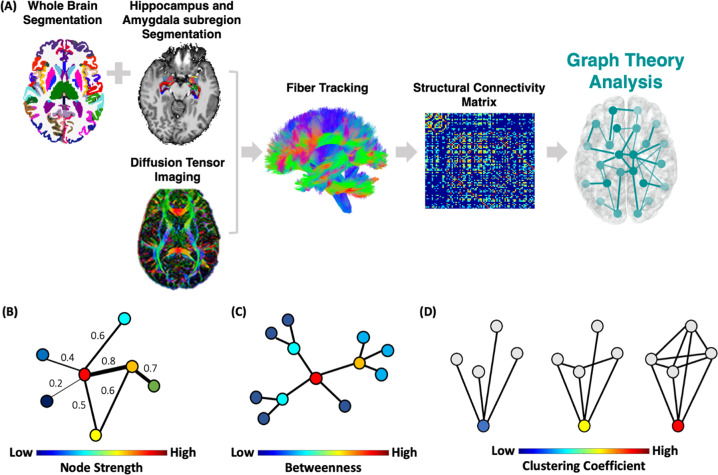
Fig. 2. Connectome analysis procedure.
A Each subject’s whole brain segmentation was combined with the hippocampus and amygdala subregion segmentation, constructing the nodes of the graph (a total of 98 ROIs). Network edges (i.e., links) were defined by the streamline count between all pairwise ROIs using probabilistic fiber tracking creating a structural connectivity matrix. A threshold of the top connections for each network was applied across a range from 0.1–0.3. We then examined the structural connectome local network centrality features; (B) node strength—the sum of weights of links connected to the brain region; (C) betweenness centrality—the number of shortest paths that traverse a given region; and D clustering coefficient, which quantifies how well a node’s neighbors are also connected to one another. Finally, for each local feature, the area under the curve for all network densities was used to provide a measure independent of single threshold selection.

