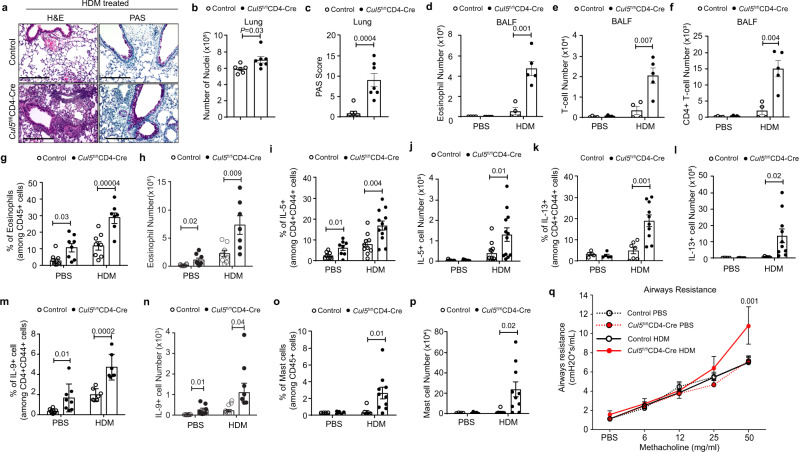
Fig. 3. Cul5fl/flCD4-Cre mice develop Th9-associated lung remodeling and airways hyperresponsiveness after allergen challenge.
8–10 week old control and Cul5fl/flCD4-Cre mice were treated with HDM or PBS. Hematoxylin and Eosin (H&E) and Periodic Acid-Schiff (PAS) stain of lungs. Representative image (a) of H&E and PAS stain (combined data shown in panels b and c). Bar graph (b) showing the number of nuclei enumerated by Aperio ImageScope software in 100 mm2 area. n = 6 control, n = 7 Cul5fl/flCD4-Cre, examined in two independent experiments. Bar graph showing PAS score (c) in lungs. n = 7 control and Cul5fl/flCD4-Cre mice, examined in two independent experiments. Total number of eosinophils (d), T cells (e), and CD4+ T cells (f) in BALF. n = 4 control, n = 5 Cul5fl/flCD4-Cre examined in 1 experiment. Frequencies (g) and numbers (h) of eosinophils in the lungs. n = 7 for Cul5fl/flCD4-Cre HDM animals; n = 8 for all other groups examined in two independent experiments. i Percentages of IL-5+ cells in lungs. For PBS group, n = 8 control and Cul5fl/flCD4-Cre mice, examined over two independent experiments. For HDM group n = 10 control, n = 12 Cul5fl/flCD4-Cre mice, examined in three independent experiments. j IL-5+ cell numbers in lungs. n = 12 control and Cul5fl/flCD4-Cre mice examined in three independent experiments. Frequencies (k) and numbers (l) of IL-13+ cells. For PBS group, n = 4 control, n = 5 Cul5fl/flCD4-Cre, examined in one experiment. For HDM group, n = 7 control, n = 11 Cul5fl/flCD4-Cre, examined in two independent experiments. Frequencies (m) and numbers (n) of IL-9+ cells. For PBS group n = 8 control and Cul5fl/flCD4-Cre mice. For HDM group n = 7 control and Cul5fl/flCD4-Cre mice, examined in two independent experiments. Frequencies (o) and numbers (p) of mast cells (FcεRIαhic-Kithi). For PBS group n = 4 control, n = 5 Cul5fl/flCD4-Cre examined in one experiment. For HDM group n = 7 control, n = 11 Cul5fl/flCD4-Cre, examined in two independent experiments. q Airways resistance measured by forced inspiration using Buxco® FinePointe system in mice administered with increasing doses of methacholine. For PBS group n = 8 control and Cul5fl/flCD4-Cre mice; for HDM group n = 7 control and Cul5fl/flCD4-Cre mice, examined in two independent experiments. Data is presented as Mean ± SEM in panels b–q. p-value is calculated by unpaired two-tailed t-test. Source data are provided as a Source Data file.

