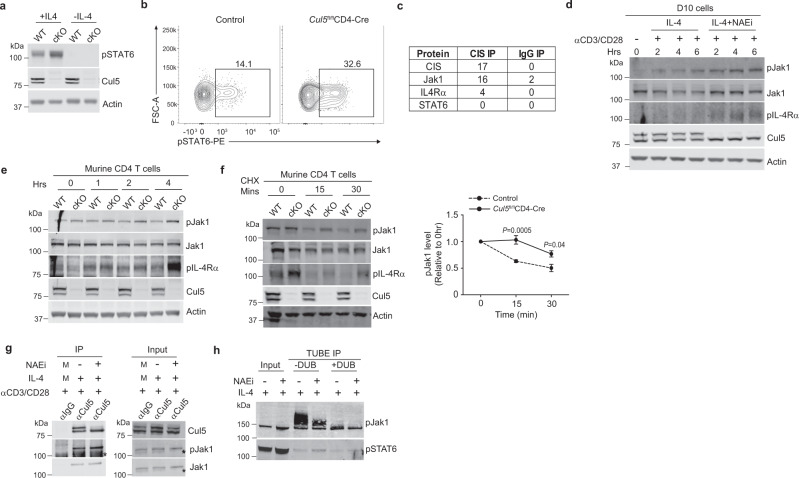
Fig. 6. CRL5 ubiquitinates and degrades pJak1.
CD4+ T cells isolated from 8–10 week old mice were stimulated for 24hrs washed and treated with 0.25 ng/ml IL-4 for 5 min in plain RPMI media. a Immunoblot showing pSTAT6 levels in control and Cul5fl/flCD4-Cre CD4+ T cells. n = 3 biologic replicates of cells examined in two independent experiments. b Flow plots showing pSTAT6 level in control and Cul5fl/flCD4-Cre CD4+ T cells by flow cytometry. n = 4 biologic replicates of cells examined in two independent experiments. c Table showing components of the IL-4 signaling pathway co-precipitated with CIS IP or IgG IP in D10 cells. n = 2 biologic replicates of cells examined in two independent experiments. d Immunoblot in D10 cells treated with IL-4 or IL-4+NAEi for the indicated time. n = 3 biologic replicates of cells examined in three independent experiments. e Immunoblot of control and Cul5 deficient CD4+ T cells isolated from 8–10-week-old mice. Cells were treated with IL-4 for the indicated time. n = 3 biologic replicates of cells examined in three independent experiments. f Immunoblot of WT and Cul5 deficient CD4+ T cells stimulated with anti-CD3 and anti-CD28 for 48 h in the presence of anti-IL-4. Cells were then washed, stimulated with IL-4 for 2 h and washed again, and treated with anti-IL-4 along with CHX for the indicated time. Graph on the right shows pJak1 levels upon CHX treatment relative to 0 h. n = 3 biologic replicates of cells examined in three independent experiments. g Immunoblot of Cul5 IP in D10 cells. n = 3 biologic replicates of cells examined in three independent experiments M: Similar amounts of lysate from all conditions was pooled for that sample. h Representative immunoblot of TUBE immunoprecipitation. D10 cells were stimulated with anti-CD3 and anti-CD28 for 4 h in the presence of IL-4 or IL-4 and NAEi. Cells were lysed and subjected to TUBE IP. The enriched fraction was divided into two parts, one part was treated with DUB and other was left untreated. 3% lysate was used for input (n = 2 biologic replicates of cells examined in two independent experiments). Data is presented as mean ± SEM in panel f. p-value was calculated by unpaired two tailed t test. Source data are provided as a Source Data file.

