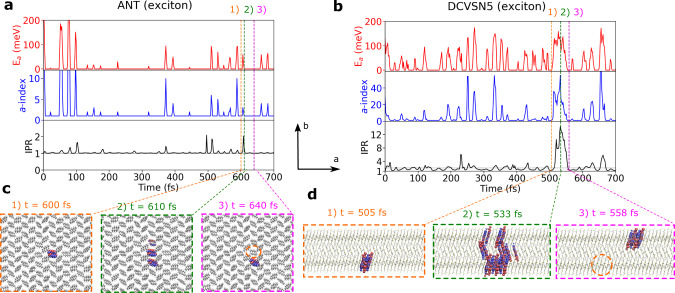
Fig. 3. Hopping and transient delocalization mechanisms for exciton transport.
Panels a, b show time series along a single representative FE-SH trajectory for ANT and DCVSN5, respectively. Top panels: energy of the active potential energy surface on which the nuclear dynamics is run in FE-SH simulations, Ea (red lines), referred to the ground state. Middle panels: index of the active exciton band state, a (blue lines, index a = 0 corresponds to the ground state which is the bottom of the excitonic band). Bottom panels: IPR(t), Eq. (8), of the excitonic wavefunction Ψ(t), Eq. (3), (black lines) and average IPR of Ψ(t) over the swarm of FE-SH trajectories (horizontal dashed gray lines). Note the correlation between the intra-band excitations, i.e., eigenstate index a, excitation energy, and IPR(t) of Ψ(t). Panel c depicts a typical nearest-neighbor hopping event of the exciton in ANT and panel d a representative transient delocalization event of the exciton in DCVSN5. Notice the much larger spatial displacement from the initial position (indicated with orange circles) in the latter case. The excitonic wavefunctions in panels (c, d), Ψ(t), Eq. (3), are represented by isosurfaces of the transition density on each molecule scaled by the expansion coefficient ul. The transition density is approximated, for visualization purposes, by the conjugated product of HOMO and LUMO orbitals.

