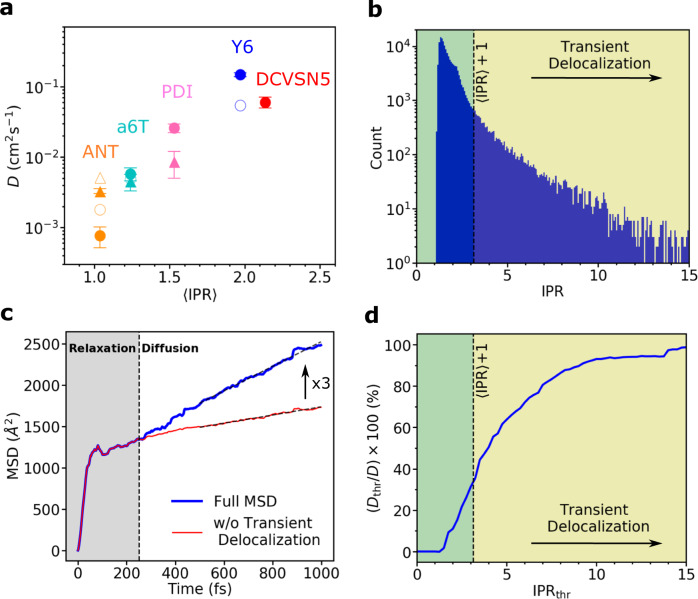
Fig. 4. Exciton diffusion constant and impact of transient delocalization.
a Exciton diffusion constant (D) as a function of the average IPR, (〈IPR〉), for the systems investigated (see Fig. 1 for their chemical and crystal structures). The diffusion constants along the crystallographic directions a and b obtained from FE-SH simulations are represented by filled circles and filled triangles pointing upwards, respectively. The average of D and 〈IPR〉 values over different system sizes is plotted. Numerical values for specific system sizes are shown in Supplementary Fig. 9. Error bars indicate the corresponding standard deviations. Diffusion constants obtained from experimental data, as described in Table 2, are indicated by empty symbols and are placed at the computed IPR value since experimental estimates for exciton delocalization are not available. The crystallographic direction for the experimental diffusion constant for Y6 and a6T was not reported. b IPR distribution obtained from 600 FE-SH trajectories for a rod-like DCVSN5 nano-crystal comprised of 300 molecules. c The full MSD of the exciton wavefunction for DCVSN5 is shown with a blue line and is calculated according to Eq. (7). The MSD obtained when transient delocalization events are excluded is shown with a thin red line. In the latter case, the IPR threshold was set to IPRthr = 〈IPR〉 + 1. Notably, a threefold increase in the diffusion constant is obtained when transient delocalization events are retained. d Accumulated percentage contribution of wavefunction delocalization events to D (i.e., (Dthr/D) × 100), plotted as a function of the IPR threshold. The green region indicates the contribution of nearest-neighbor hopping to D, whereas the yellow region indicates the contribution due to transient delocalization.

