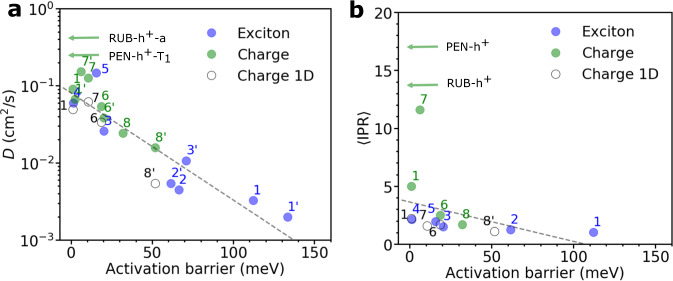
Fig. 5. Comparison charge vs exciton transport.
Correlation between a the diffusion constant (D, Eq. (6)) and b the time average inverse participation ratio (IPR, Eq. (8)) of charges and excitons against the activation barrier (Eq. (1)) for different systems, respectively. Data from present exciton transport simulations are depicted in blue (ANT (1), a6T (2), PDI (3), DCVSN5 (4), and Y6 (5)). Data for charge transport simulations for the 2D conductive layers of OSs are taken from ref. 49 and depicted in green (ANT (1), naphthalene (6), perylene (7), pMSB (8), rubrene (RUB), and pentacene (PEN)). For 2D simulations, two data points are shown for diffusion constant and activation barrier, one for the direction of highest coupling (unprimed number) and one for the direction of second highest coupling (primed number). PEN-h+-T1 and RUB-h+-a denote hole transport along a crystallographic direction indicated. For comparison, 1D charge transport simulations (taken from ref. 8) are indicated by empty black circles and the values reported along the chain direction. The best linear fits to the data are indicated by dashed gray lines.

