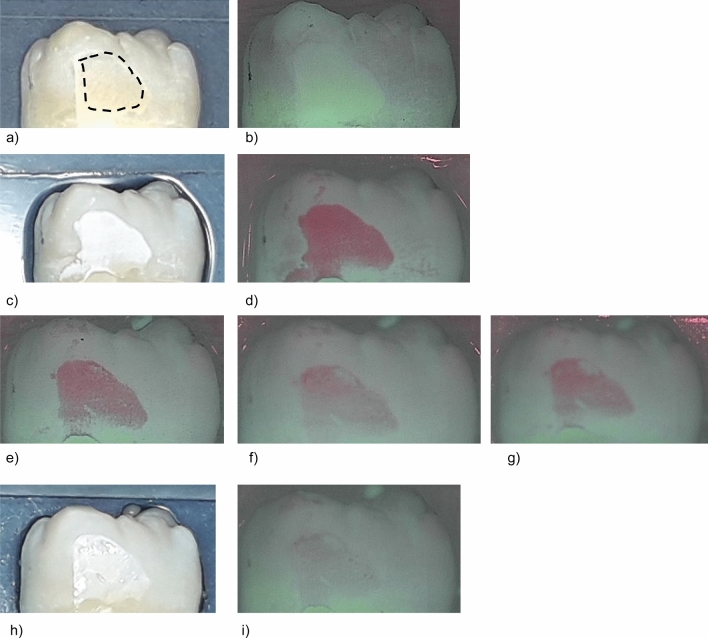
Figure 3.
Standard image and QLF image of a representative sample in group III (Cervitec F, sample #09) at different investigation times. The dashed line indicates the ground surface where the QLF measurements were performed. (3a) Prior to demineralization. (b) Corresponding QLF-image: ΔF = 0.0%; ΔFmax = 0.0%. (c) After demineralisation (T-demin). (d) Corresponding QLF-image (T-demin): ΔF = ΔF = − 16.5%; ΔFmax = − 30.5%. (e) QLF image T07: ΔF = − 14.7%; ΔFmax = − 27.1%. (f) QLF image T14: ΔF = − 8.9%; ΔFmax = − 19.8%. (g) QLF image T21: ΔF = − 9.8%; ΔFmax = − 19.4%. (h) 28 days after demineralisation (T28). (i) Corresponding QLF-image (T28): ΔF = − 6.3%; ΔFmax = − 9.8%.

