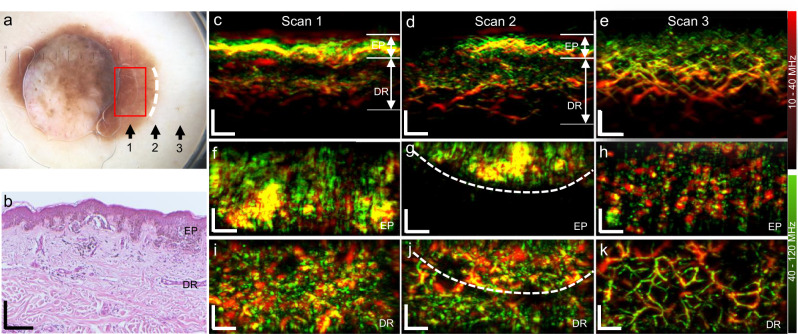
Fig. 3. Vascular imaging of melanoma and the surrounding skin tissue from a patient with melanoma (female).
a Photograph of a melanoma lesion; Black arrows and labels (1, 2, 3) indicate the three scanning positions, corresponding to the tumor base, the lesion edge and the surrounding skin tissue. The red rectangle depicts the field-of-view of 4 × 2 mm2. b Histological image of the melanoma sample corresponding to the area (label 1) marked by the red rectangle in (a). c–e MIP cross-sectional FRSOM images of the three scanned regions (labels 1, 2, 3). f–h MIP images in the coronal direction corresponding to the epidermal (EP) layer of (c–e). i–k Coronal images corresponding to the dermal (DR) layer of (c–e). The white dashed lines in (g) indicate the border between the pigmented lesion and the close surrounding skin tissue. Comparing the dermal vascular structures of (i–k), a dense dotted vascular pattern is clearly visualized in the tumor base area (i); irregular vasculature (j) is also resolved in the lesion edge area, while the vasculature networks become more regular in the surrounding skin tissue (k). All images are color-coded to represent the two reconstructed frequency bands (red: larger structures in the bandwidth of 10–40 MHz; green: smaller structures in the bandwidth of 40–120 MHz). The three scans from the same patient with melanoma was measured once. All scale bar: 500 µm.

