Table 3.
Trait–environment relationships in urban wild bee and hoverfly assemblages (fourth-corner analysis)
| Taxon | Functional trait | Urbanisation | Connectivity | |
|---|---|---|---|---|
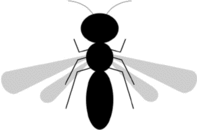 Wild bees Wild bees |
Sociality |
 Eusocial Eusocial |
+* | -** |
Cleptoparasitic
|
-** | |||
| Nesting |
 Endogeic Endogeic |
+* | ||
Cleptoparasitic
|
-** | |||
| Diet |
 Polylectic Polylectic |
+** | ||
Cleptoparasitic
|
-** | |||
 Body size Body size |
-* | +* | ||
 Hoverflies Hoverflies |
Larval food type |
 Terrestrial saprophagous Terrestrial saprophagous |
+* | |
| Migratory status |
 Migrating Migrating |
-*** | ||
Asterisks show positive (+) or negative (-) trait–environment relationships with P < 0.05. All relationships with 0.01 < P < 0.05 are shown with one asterisk (*), relationships with 0.001 < P < 0.01 are depicted with two asterisks (**), and relationships with P < 0.0001 are shown with three asterisks (***)
