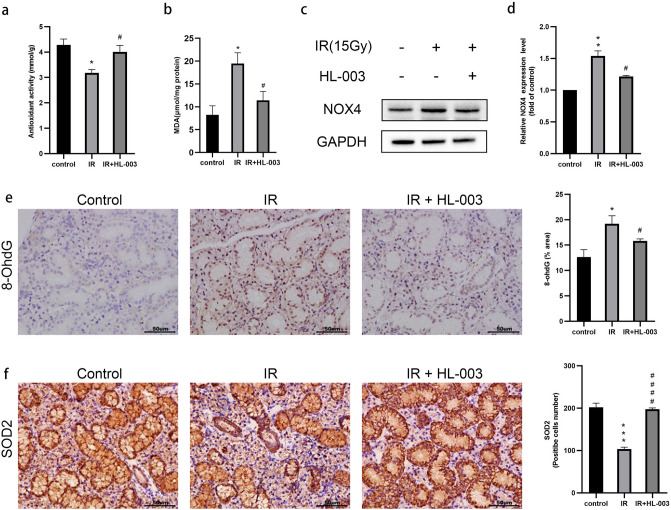
Figure 3.
HL-003 reduces oxidative stress. (a) Total antioxidant capacity levels were determined. (b) The concentration of MDA was determined. (c,d) Western blot analysis of NOX4. Relative quantification of the expression of NOX4 is shown. (e,f) Representative immunohistochemical images of 8-OHdG and SOD2. Scale bars represent 50 μm. Relative quantitative analysis is shown. Each bar shows the mean ± SEM; *p < 0.05, **p < 0.01, ***p < 0.001, compared with the control group; #p < 0.05, ####p < 0.0001, compared with the IR group (n = 6 per group).

