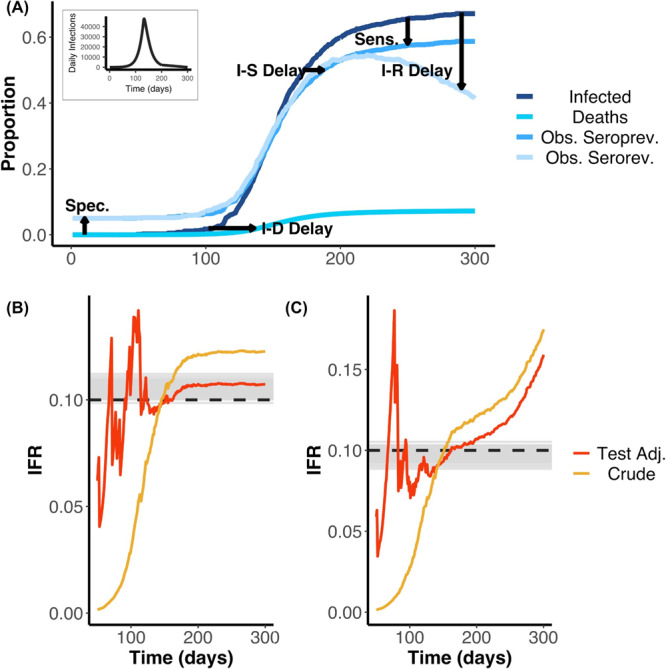
Fig. 1. IFR estimates from serologic data.

A Schematic showing cumulative infections, deaths and seroprevalence with and without seroreversion over time. We highlight the effects of delays from infection to seroconversion (I–S Delay), to death (I–D Delay), and to seroreversion (I–R Delay) as well as serologic test sensitivity (Sens.), serologic test specificity (Spec.) on the observed data. The daily infection curve used as input for the simulation is shown as the plot inset. Early in the outbreak, false positives dominate due to low prevalence and imperfect specificity, whilst later the difference between true cumulative incidence and observed seroprevalence is mainly due to low sensitivity and/or seroreversion. The delays show how the cumulative infection curve is lagged behind the observed seroprevalence. Similarly, the contrast of the seroprevalence curve with (Obs serorev) and without (Obs seroprev) seroreversion reveals the loss of sensitivity over time. These simulations were used as the inputs for the results displayed in (B, C). We used 0.1% of the simulated data at random (i.e. we do not assume we observe the entire population through time). B Estimated IFR over time based on a simulated epidemic that does not include seroreversion. Here, the simulated IFR value is indicated by the dashed black line and the grey lines indicate 100 posterior draws from the fitted statistical model (based on the posterior probability), indicating the capacity for our model framework to correctly recover the true IFR. Red and yellow lines represent the simple and test-adjusted (Rogan-Gladen correction) IFR estimates (see Main Text), calculated as if the serosurvey had been conducted on each respective day (after day 50). In the case without seroreversion, the IFR appears to be adequately captured by the Rogan-Gladen correction once infections have stopped accruing (the realised IFR appears to be slightly greater than the initial simulated true IFR value of 0.1). C As for (B), but the simulation and statistical model both include seroreversion. The IFR values are shown as a probability. In the case that includes seroreversion, the Rogan-Gladen correction can no longer adequately capture the IFR value, as seroprevalence estimates are constantly changing. In addition, in the outbreak, when the true seroprevalence is less than the false positive rate, adjusting for the serologic test characteristics can result in unstable IFR estimates.
