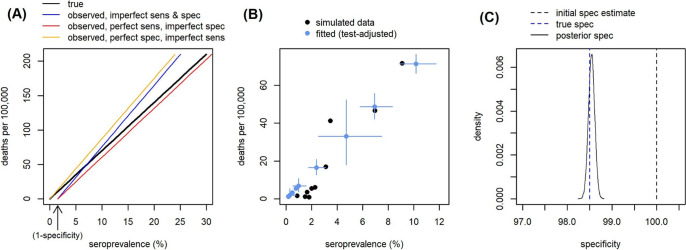
Fig. 4. Estimating serologic test specificity from regional data.
A Expected relationship between seroprevalence and deaths per 100,000 under different values of serologic test sensitivity and specificity, when overall IFR = 0.7% and both IFR and population age structure are constant. B Example simulation of seroprevalence and deaths per 100,000 in different regions within a serosurvey (black), assuming varying burden of COVID-19 and population sizes between regions, but constant test performance and IFR. Model-estimated mortality and seroprevalence (adjusted for test performance) for each region when fitting to the simulated data (blue; error bars = 95% CrI). Serologic test performance is simultaneously estimated by the model, using informative priors from a simulated validation study and the relationship between seroprevalence and mortality. C Initial prior specificity estimate based on a simulated validation study including 100 true negative cases (black dashed line); by chance 100% specificity was measured in the simulated validation study, although the true value is 98.5% (blue dashed line). The model fitted to simulated regional data is able to infer a much more accurate posterior specificity estimate (black solid line shows posterior distribution).

