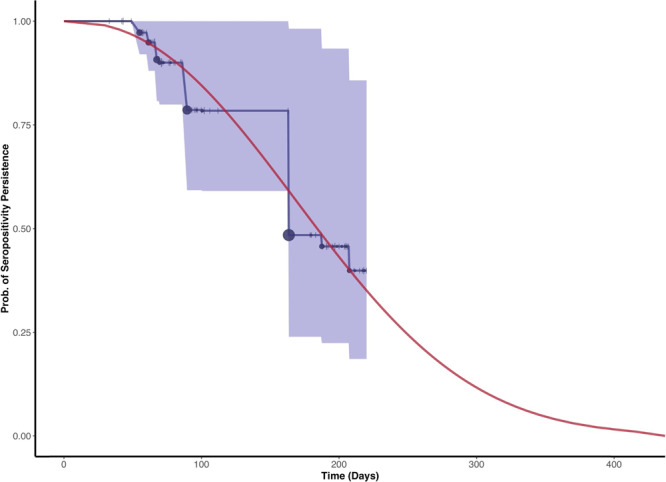
Fig. 5. Seroreversion data and model fit.

Persistence of seropositive test results with the Abbott assay among an extended cohort of 101 COVID-19 patients (extended dataset based from Muecksch et al.25). The interval-censored Kaplan–Meier survival curve with 95% confidence intervals (blue) with censored observations (ticks) and seroreversion events (circles) is shown for comparison. Both censoring (range 1–4) and seroreversion events (range 0–16.16) are scaled according to the number of observations on the given day. The fitted Weibull survival function (red) of persistence of a serologic positive result is shown in red. The fit was estimated from symptom onset to time of seroreversion, where the time of seroreversion was estimated incorporating interval censoring. The mean time from symptom onset to seroreversion was 190.93 days.
