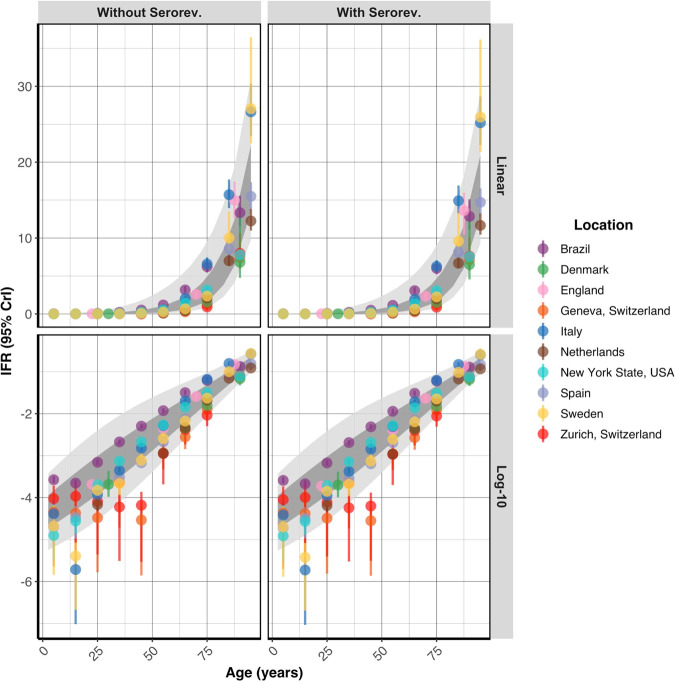
Fig. 7. Age-stratified infection fatality ratio estimate.
The age-specific modelled IFR (%) median and 95% credible interval estimates with and without seroreversion are plotted on a linear and log-10 scale (mean age within each age group plotted). The 95% prediction intervals (light grey) and the 80% prediction intervals (dark grey) calculated from the age-specific pooled-IFR estimates are shown for each model. The IFR increases in a log-linear fashion with age.

