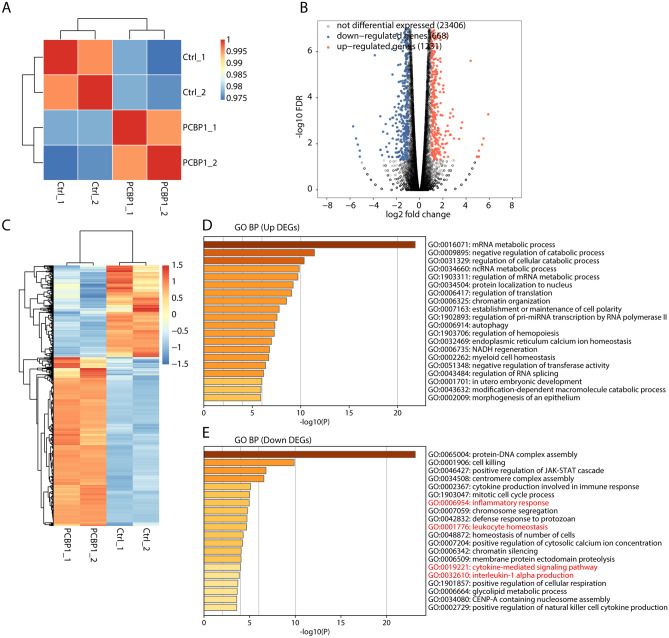
Figure 2.
Transcriptome analysis of differentially expressed genes (DEGs) in Pcbp1-knockdown Th1 cells and control Th1 cells. (A) Hierarchical clustering heat map showed correlation between Pcbp1-knockdown and control samples based on FPKM value of all expression genes. (B) Volcano plot showed all DEGs between Pcbp1-knockdown and control samples with edgeR. FDR < 0.05 and FC (fold change) ≥ 2 or ≤ 0.5. (C) Hierarchical clustering heat map showed expression levels of all DEGs. (D) Bar plot exhibited the most enriched GO biological process results of the up-regulated DEGs, that making use of analyses by Metascape. (E) Bar plot exhibited the most enriched GO biological process results of the down-regulated DEGs, that making use of analyses by Metascape.

