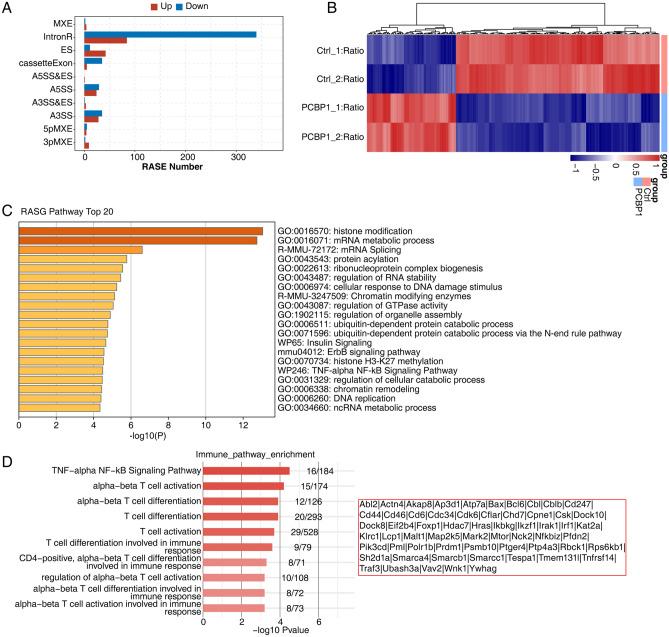
Figure 3.
Transcriptome analysis of alternative splicing regulation in Pcbp1-knockdown and control samples. (A) The bar plot showed the number of all significant regulated alternative splicing events (RASEs). X-axis: RASE number. Y-axis: the different types of AS events. (B) Hierarchical clustering heat map of all significant RASEs based on splicing ratio. AS filtered should have detectable splice junctions in all samples and at least 80% samples should have > = 10 splice junction supporting reads. (C) Bar plot exhibited the most enriched pathways results of the regulated alternative splicing genes (RASGs), that making use of analyses by Metascape. (D) Bar plot exhibited the most enriched immune pathways results of the regulated alternative splicing genes (RASGs),and the list of genes was on the right.

