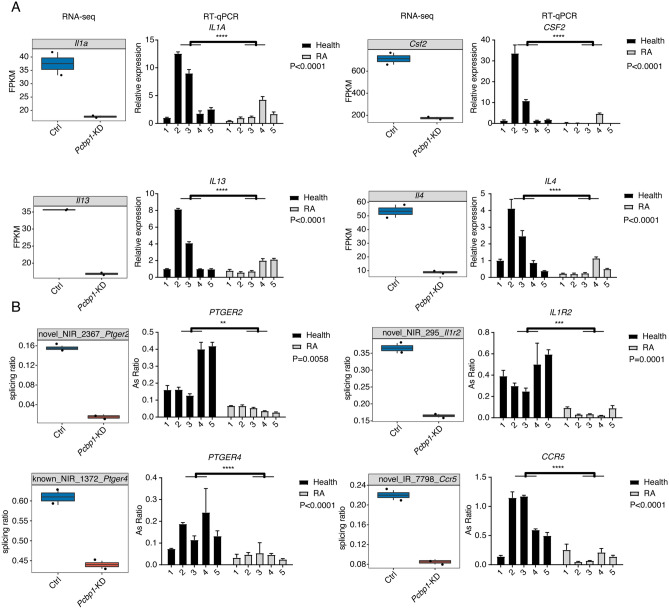
Figure 6.
Experimental validation on DEGs RASGs by PCBP1 in PBMCs specimens from RA patients. (A) Bar plot showing the RT-qPCR validation results of immune and inflammation related DEGs regulated by PCBP1 in PBMCs from RA. Box plot in the left panel was expression level from RNA-seq in mice, and right panel was RT-qPCR result from RA patients. (****P-value < 0.0001; two-ways ANOVA test). (B) Bar plot showing the RT-qPCR validation results of immune and inflammation related RASEs regulated by PCBP1 in PBMCs from RA. Box plot in the left panel was AS ratio from RNA-seq in mice, and right panel was RT-qPCR result from RA patients. (**P-value < 0.01; ***P-value < 0.001; ****P-value < 0.0001; two-ways ANOVA test).

