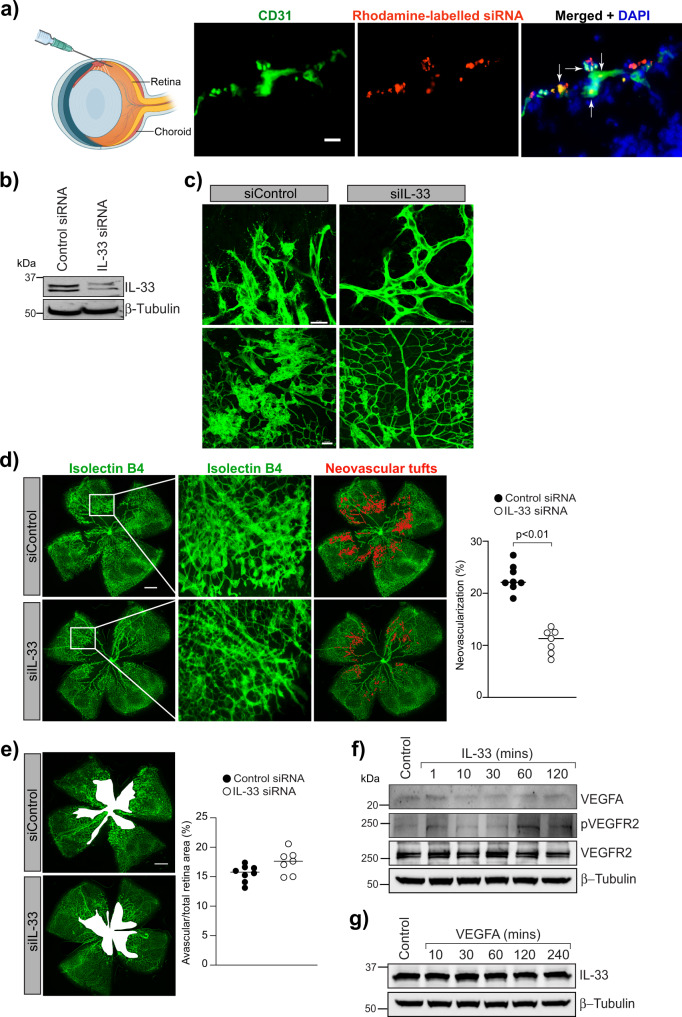
Fig. 2. IL-33 regulates OIR-induced retinal neovascularization.
a C57BL/6 mice pups were exposed to 75% oxygen (P7–P12), returned to room air and administered intravitreally with 0.5 μl of in-vivofectamine 3-siRNA duplex solution containing 0.6 μg of rhodamine-labeled non targeted siRNA at P12 and P14. At P15, the eyes were enucleated, retinas isolated, fixed, sections made, and stained with anti-CD31 antibodies. The white arrow indicates the colocalization of CD31 with rhodamine labeled siRNA. b Everything is same as in a, except that mice pup were injected intravitreally with control siRNA (siControl) or IL-33 siRNAs (siIL-33) at P12, and P14. At P17 the retinal tissue extracts were prepared and analyzed for IL-33 levels by Western blotting and normalized to β-tubulin. c, e Everything is same as in b, except that the retinas were stained with isolectin B4, flat mounts prepared and examined for endothelial tip cell formation (c) retinal neovascularization (d) and avascular area (e). f, g Quiescent HRMVECs were treated with and without IL-33 (20 ng/mL) or VEGFA (40 ng/mL) and analyzed for VEGFA, pVEGFR2, VEGFR2 and IL-33 levels using Western blotting and normalized to β-tubulin. The middle column in d shows the higher magnification of the area selected. Neovascularization is highlighted in red in the third column of d. The bar graphs represent quantitative analysis of neovascularization and avascular area and expressed as Mean ± SD. *P < 0.05 vs siControl). Scale bar represents 20 μm in a, 20 μm in c upper row, 50 μm in c lower row, 500 μm in d and e.

