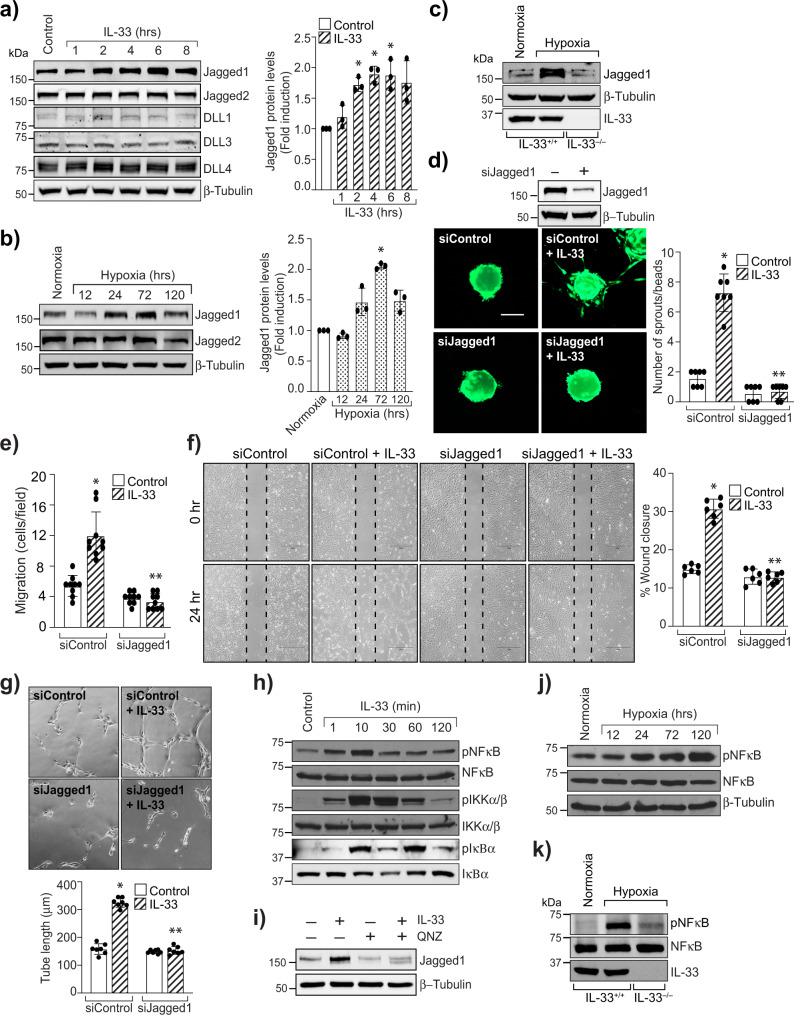
Fig. 6. Jagged1 mediates IL-33-induced angiogenic effects.
a HRMVECs were treated with IL-33 (20 ng/mL) for various time periods, cell extracts prepared and analyzed by Western blotting for Jagged1, Jagged2, DLL1, DLL3, DLL4 levels and normalized to β-tubulin. b Retinal tissue extracts from C57BL/6 normoxia and various time periods of hypoxia were analyzed for the indicated proteins by Western blotting and normalized to β-tubulin. c At P15, retina tissue extracts from IL-33+/+ and IL-33−/− mice pups were analyzed by Western blotting for indicated proteins and normalized to β-tubulin. n = 6 animals per group. d Upper panel, HRMVECs were transfected with control siRNA (siControl) or Jagged1 siRNA (siJagged1), after 48 h cell extracts were analyzed for Jagged1 levels by Western blotting and normalized to β-tubulin. Lower panel, all the condition are same as in upper panel, except that the cells were analyzed for IL-33 (20 ng/mL)-induced sprouting. e–g All the condition are same as in upper panel d except HRMVECs were treated with and without IL-33 (20 ng/mL) and subjected to migration (e, f), and tube formation assay (g). h Cell extracts treated with various time periods of IL-33 (20 ng/mL) were analyzed by Western blotting for the indicated proteins. i Quiescent HRMVECs were first treated with QNZ (10 μM, NFkappaB inhibitor) for 30 min, followed by with or without IL-33 (20 ng/mL) treatment for 2 h. The cell lysates were prepared and analyzed for Jagged1 levels by Western blotting and normalized to β-tubulin. j Everything was same as in b, except that retinal extracts were analyzed for the indicated proteins by Western blotting. k At P15, the retinal tissue extracts from IL-33+/+ and IL-33−/− mice pups subjected to normoxia and hypoxia analyzed for indicated proteins by Western blotting. n = 6 animals per group. The bar graphs show quantitative analysis of three independent experiments, expressed as Mean ± SD. *P < 0.05 vs control siRNA or normoxia, **p < 0.05 vs control siRNA + IL-33. Scale bar represents 50 μm in d.

