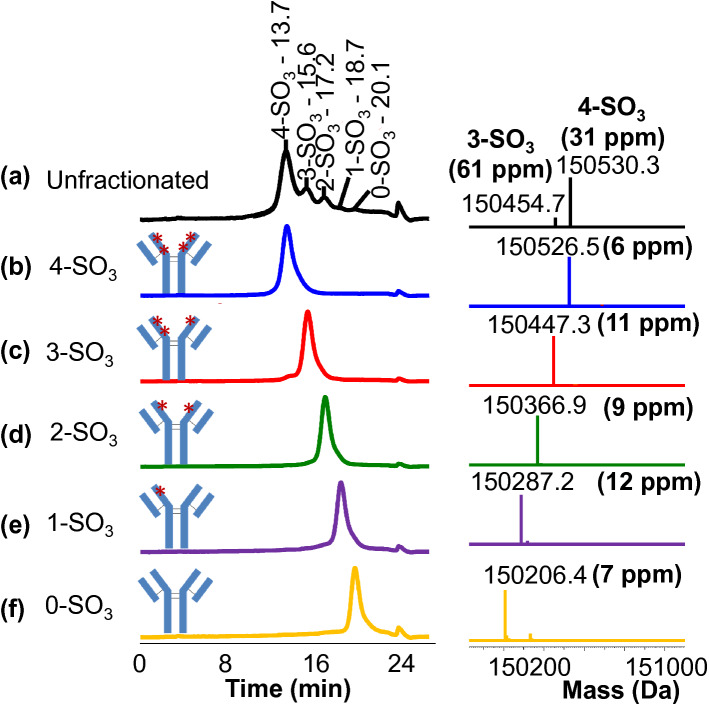
Figure 1.
HIC-UV chromatograms and RPLC-mass spectrometry analysis distinguishing CAP256V2LS sulfation proteoforms. Traces on the left are CAP256V2LS analyzed by HIC-UV. (y-axis is the UV absorbance, normalized to the highest peak intensity in each chromatogram). On the right, deconvoluted Reversed phase coupled with intact mass analysis from each peak fraction corresponding to the left elution after deglycosylation. (y-axis is the mass intensity, normalized to the highest peak in each mass spectrum.) (a) Unfractionated CAP256V2LS showed five peaks on HIC-UV chromatograms, with the peak of 4-SO3 and 3-SO3 species detected in RPLC-MS. (b) 4-SO3 eluted first at 13.7 min with mass confirmed at 150,526.5 Da. (c) 3-SO3 eluted at 15.6 min with mass of 150,447.3 Da. (d) 2-SO3 eluted at 17.2 min with mass observed at 150,366.9 Da. (e) 1-SO3 eluted at 18.7 min with mass detected at 150,287.2 Da. (f) 0-SO3 eluted last at 20.1 min with mass measured at 150,206.4 Da.

