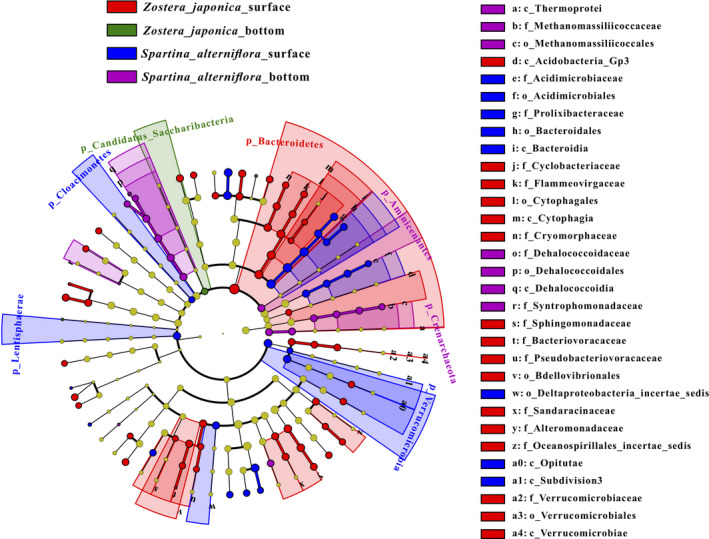
FIGURE 4.

The output of the LEfSe algorithm, which identifies taxonomically consistent differences between Z. japonica surface, Z. japonica bottom, S. alterniflora surface and S. alterniflora bottom community members, was visualized. Different colors represent different groups. For example, the red circle in the branch indicates the species with significantly high abundance in the red group. Taxa with nonsignificant differences are represented as yellow circles, and the diameters of the circles are proportional to absolute abundance
