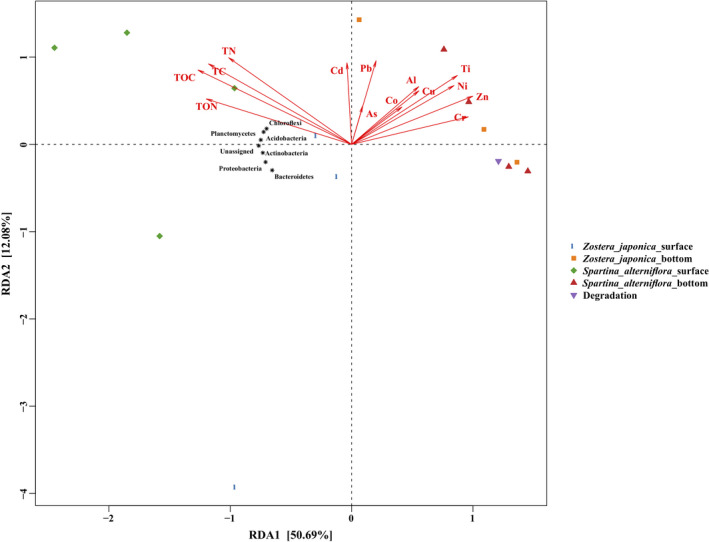
FIGURE 6.

Redundancy analysis (RDA) diagram illustrating the relationships between the compositions of sediment bacterial communities at the phylum level from different groups under variable environments. Pb (Cr, Co, Ni, Cu, Zn, As, Cd, Al, Ti, V, Mn, Fe), the heavy mental concentrations in sediment; TC, total carbon; TN, total nitrogen; TOC, total organic carbon; TON, total organic nitrogen
