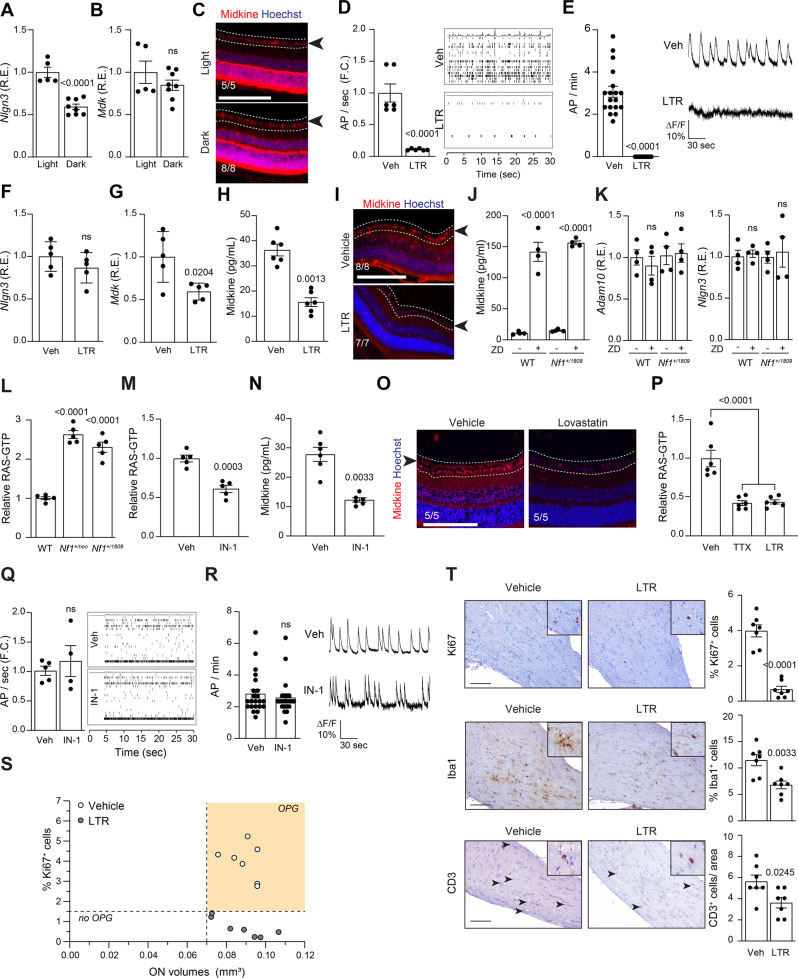
Fig. 3. OPG-associated Nf1-mutant neuronal hyperexcitability is HCN channel-dependent.
A Neuroligin (Nlgn3; P < 0.0001) but not (B) midkine (Mdk; ns not significant) transcript relative expression is decreased in retinae of Nf1+/neo mice following dark-rearing from 4 to 8 weeks. Light-reared n = 5, dark-reared n = 8. C Midkine expression is not reduced in the RGC layer (dotted lines, black arrow) or retinae in 8-week-old Nf1+/neo mice following dark-rearing from 4 to 8 weeks. Light-reared n = 5, dark-reared n = 8. D, E RGC activity is reduced following 200 µM lamotrigine (LTR) treatment, as measured by (D) multi-electrode array (vehicle n = 6; LTR n = 6; P < 0.0001), or (E) calcium imaging (vehicle n = 18; LTR n = 18; P < 0.0001). Right panels: representative (D) spike plots of entire multi-electrode array well recordings over 30 s, and (E) traces of neuronal activity over 3 min. F Nlgn3 relative expression is unaltered (ns not significant), while (G) Mdk transcript relative expression is decreased in retinae of Nf1+/neo mice following LTR treatment in vivo. n = 5 for all groups. P = 0.0204. H, I Midkine expression is reduced in (H) Nf1+/neo RGC neurons in vitro (n = 6 for all groups; P = 0.0013), and (I) in the RGC layer (dotted lines, black arrow) of retinae in 12-week-old Nf1f/neo; GFAP-Cre (Nf1-OPG) mice following LTR treatment in vivo (vehicle n = 8; LTR n = 7). J, K ZD7288 (ZD) treatment (30 µM) of WT and Nf1+/1809 RGC neurons (J) increased midkine production (P < 0.0001), but (K) did not alter Adam10 or Nlgn3 transcript expression in vitro (ns, not significant). n = 4 for all groups. L, M RAS activity is elevated in Nf1+/neo and Nf1+/1809 (L) RGC neurons relative to WT controls (P < 0.0001), and (M) is reduced in Nf1+/neo neurons following IN-1 treatment (1 µM; P = 0.0003). n = 5 for all groups. N Midkine levels are reduced in Nf1+/neo RGC neurons following IN-1 treatment. n = 6 for all groups; P = 0.0033. O RGC layer (dotted lines, black arrow) midkine expression is reduced following lovastatin treatment of 12-week-old Nf1-OPG animals in vivo. n = 5 for all groups. P RAS-GTP is reduced in TTX (1 µM)- and LTR-treated Nf1+/neo RGCs. n = 6 for all groups, P < 0.0001. Q, R Nf1+/neo RGC neuron AP firing rate is not reduced following IN-1 treatment, as measured by (Q) multi-electrode array (vehicle n = 5; IN-1 n = 4), or (R) calcium-imaging recordings (vehicle n = 22; IN-1 n = 22). Right: Q spike plots of entire multi-electrode array well recordings over 30 s, and (R) traces of neuronal activity over 3 min. ns, not significant. S Graph demonstrating the relationship between optic nerve volumes and Ki67+ cells in vehicle- and LTR-treated Nf1-OPG optic nerves. n = 7 for both groups. T LTR-treated Nf1-OPG mouse optic nerves have reduced Ki67+ (P < 0.0001), Iba1+ (P = 0.0033) and CD3+ cells (P = 0.0245) relative to vehicle-treated Nf1-OPG mice. n = 7 for all groups. Scale bars, 100 µm. Data are represented as means ± SEM, (A, B, D–G, M, Q, R, T) unpaired two-tailed Student’s t test, (H, N) paired Student’s t test, (J–L, P) One-way ANOVA with (J) Tukey’s or (K, L, P) Dunnett’s post-test correction. P values are indicated within each panel. ns, not significant. Source data are provided as a Source Data file.

