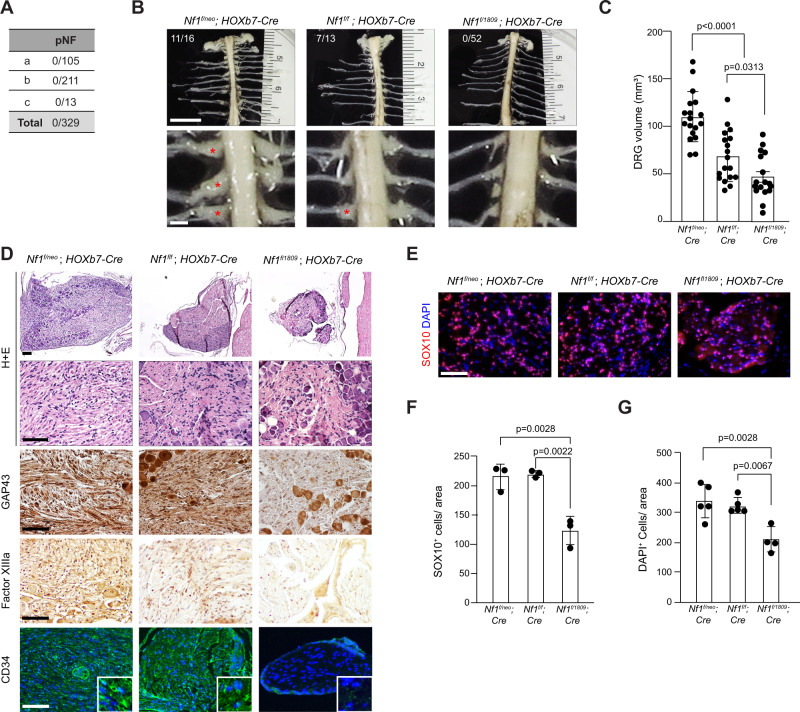
Fig. 4. Arg1809Cys Nf1-mutant mice do not develop neurofibromas following somatic Nf1 inactivation.
A Incidence of peripheral nervous system tumors in NF1 patients harboring the c.5425 C > T NF1 germline mutation. pNF: plexiform neurofibroma; (a)44, (b)45, (c)40. B Representative gross images (bright field) of spinal cords from 6-month-old Nf1f/neo; Hoxb7-Cre (n = 16), Nf1f/f; Hoxb7-Cre (n = 13), and Nf1f/1809 ; Hoxb7-Cre (n = 52) mice, showing (C) enlarged DRG (red asterisks) in Nf1f/neo; Hoxb7-Cre (n = 17; P < 0.0001) and Nf1f/f; Hoxb7-Cre mice (n = 17; P = 0.0313), but not in Nf1f/1809 ; Hoxb7-Cre mice (n = 17). Scale bars: 1 mm. The number of mice that formed pNFs is also shown in the top panels in (B). D, E Representative (D) H + E staining, GAP43, Factor XIIIa and CD34 staining, and (E) SOX10 and S100β, immunostaining. n = 4 for all groups. F, G Quantification of SOX10+ (n = 3 for all groups; Nf1f/neo; Hoxb7-Cre, P = 0.0028; Nf1f/f; Hoxb7-Cre, P = 0.0022) and DAPI+ cells (Nf1f/neo; Hoxb7-Cre, n = 5, P = 0.0028; Nf1f/f; Hoxb7-Cre, n = 5, P = 0.0067; Nf1+/1809; Hoxb7-Cre, n = 4) in DRGs. Scale bars, 50 µm. Data are presented as the mean ± SEM. One-way ANOVA with Tukey’s test for multiple comparison. Source data are provided as a Source Data file.

