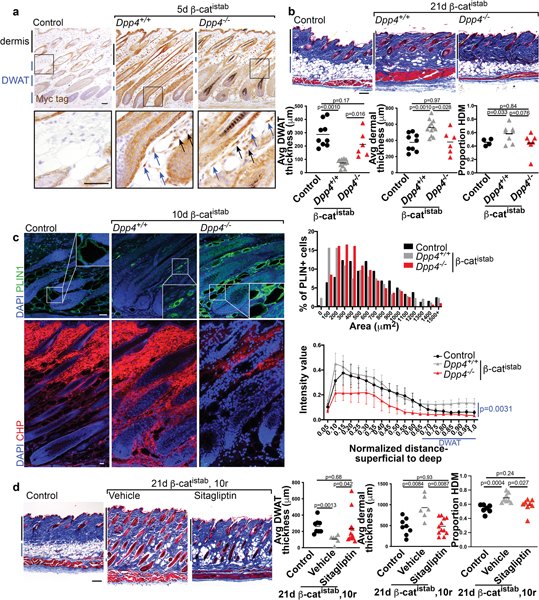
Figure 4: DPP4 mediates dermal remodeling in β-catistab dermal fibrosis model.
a, Myc-tag IHC in control, Dpp4+/+ 5d β-catistab, and Dpp4−/− 5d β-catistab dorsal dermis; blue arrows indicate adipocytes with high signal, black arrows indicate fibroblasts with high signal; scale bar=100μm. b, Masson’s trichrome stained dorsal skin of control, Dpp4+/+ 21d β-catistab, and Dpp4−/− 21d β-catistab; quantification of dermal and DWAT thickness/mouse (n=6–10) and proportion of collagen high density matrix (n=4–8); scale bar=200μm. c, Indirect immunofluorescence staining for PLIN1 (green) and CHP staining (red) in mouse skin from control, Dpp4+/+ 10d β-catistab, and Dpp4−/− 10d β-catistab mice with histogram of PLIN1+ vesicle size (n=6–9) and DWAT CHP intensity heatmap by skin depth with standard error bars; significance between DWAT region intensity values only; scale bar=25μm. d, Masson’s trichrome stained mouse skin from control, 21d β-catistab and 10d reversal with vehicle or sitagliptin treatment; scale bar=200μm; quantification of dermal, DWAT thickness, and HDM/mouse(n=6–11).

