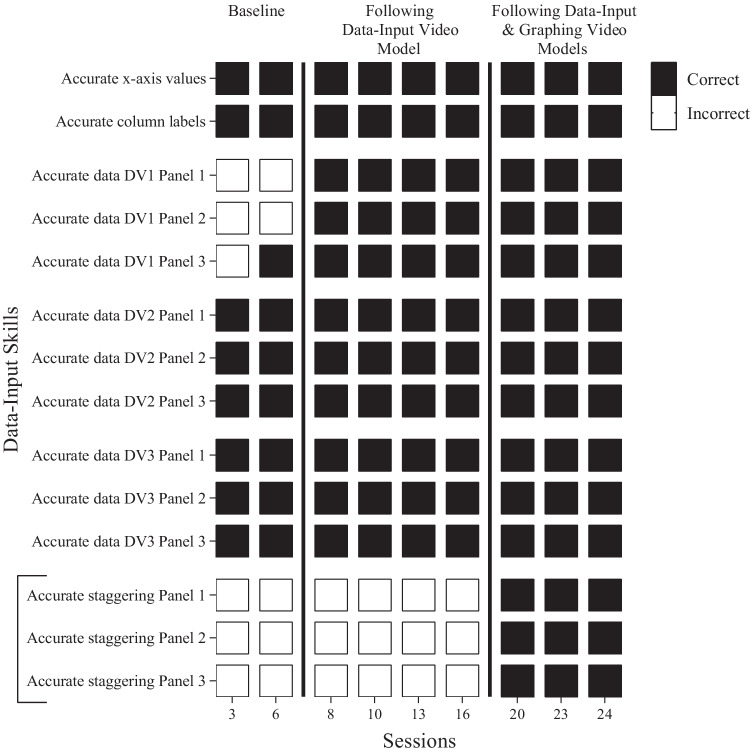
Fig. 4.
Heat map of Myrtle’s data-input skills from Mitteer, Greer, et al. (2020). Note. This depicts Myrtle’s data-input performance during the combined-probe arrangement (i.e., inputting data correctly and then graphing those data) in baseline, after experiencing a video model for data-input only, and after experiencing both data-input and graphing trainings. The bracket highlights the critical skill of staggering data across data-table columns such that phase-changes are represented appropriately in the graph. DV = dependent variable

