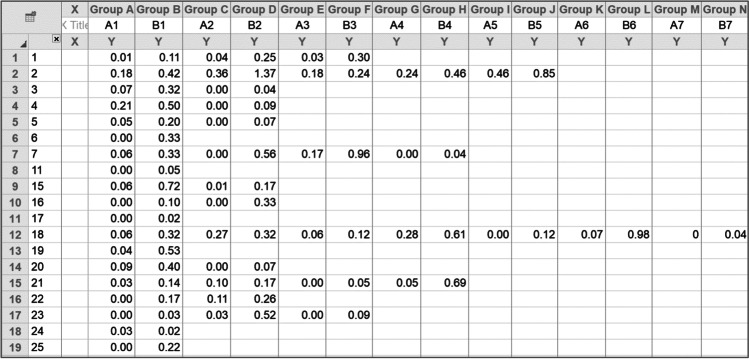
Fig. 8.
Data table used to create Fig. 7. Note. Data table displaying destructive behavior during schedule-thinning steps as proportion-of-baseline values. Entering the above values results in Prism shading the tiles automatically based on the range of values. Prism can also display the values within each tile as an optional feature

