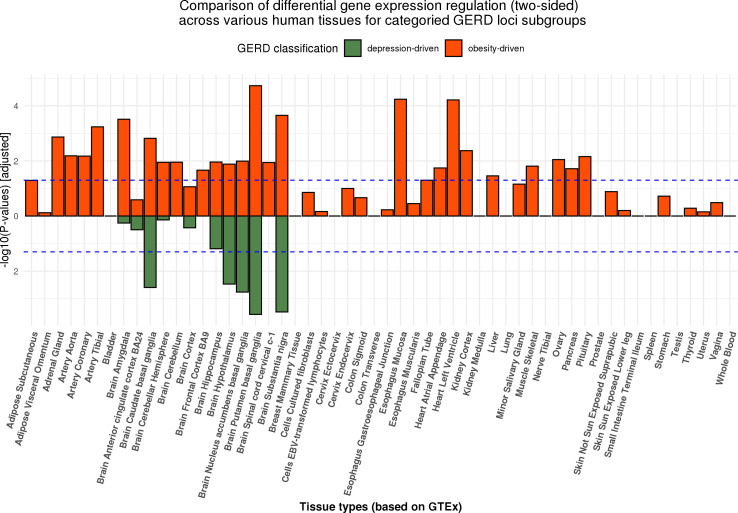
Figure 5.
MAGMA gene-based tissue enrichment analysis for categorised functional and non-functional GERD gene sets on 53 human tissues. The dotted line represents the Bonferroni corrected significance threshold. While both the obesity-driven and neuropsychiatric-driven GERD genes were differentially expressed in brain tissues, only the regulation of gene expression in oesophageal tissues were detected from the obesity GERD gene set. Another observation is that the pattern of regulation is more pleiotropic across tissues for the obesity GERD set, consistent with the complex architecture of adiposity. The results for up-ward and down-ward regulation of gene expression can be viewed in online supplemental materials. GERD, gastro-oesophageal reflux disease

