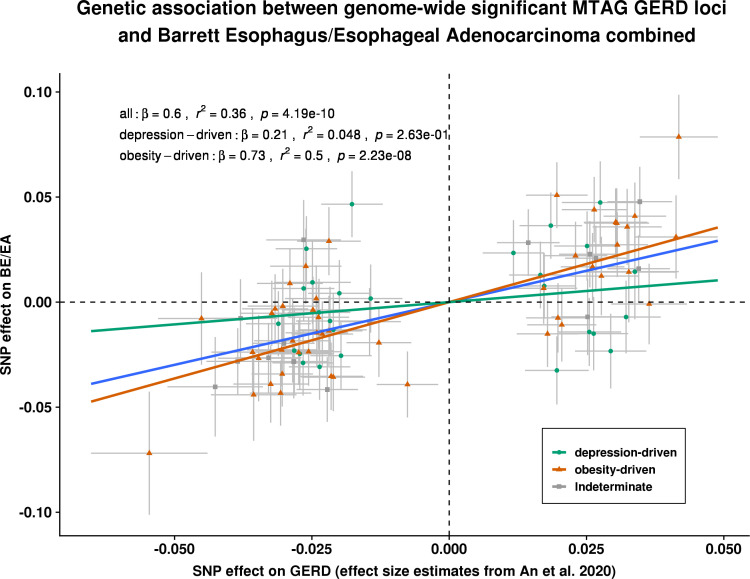
Figure 6.
Estimation of the genetic association between GERD and BE/EA, stratified by genetic GERD subtypes. Each of the slopes represents the estimated magnitude of association between per unit increase in log(OR) of GERD on log(OR) of BE/OA, for all GERD loci (line in blue), obesity-driven GERD loci (line and points in green), and neuropsychiatric-driven GERD loci (line and points in orange) using an inverse variance weighted regression model. Cochran Q statistics indicated strong heterogeneity in the overall all-GERD estimate (p<0.001). In the stratified analysis, it becomes apparent that the overall estimate was primarily driven by the much stronger effect sizes from the obesity-driven GERD loci subset. BE, Barrett’s oesophagus (or Barrett’s esophagus); EA, oesophageal adenocarcinoma (or esophageal adenocarcinoma); GERD, gastro-oesophageal reflux disease; MTAG, multitraitanalysis of GWAS; SNP, single nucleotide polymorphism.

