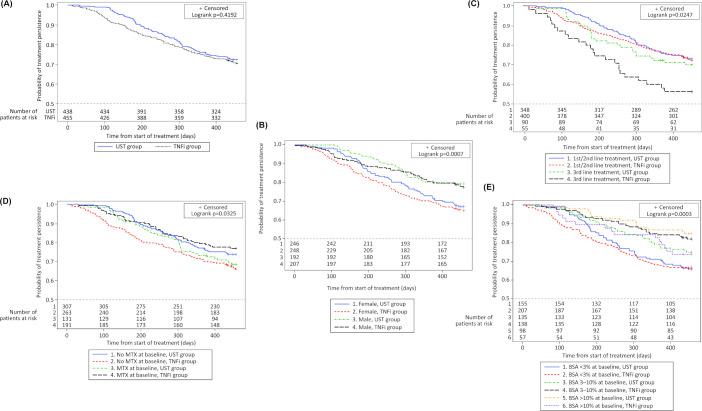
Figure 1.
Kaplan-Meier plots of treatment persistence with ustekinumab versus TNFi (A) Overall, (B) By sex, (C) By treatment line, (D) By presence/absence of methotrexate and (E) By extent of skin involvement at baseline. BSA, body surface area; MTX, methotrexate; TNFi, tumour necrosis factor inhibitor; UST, ustekinumab.

