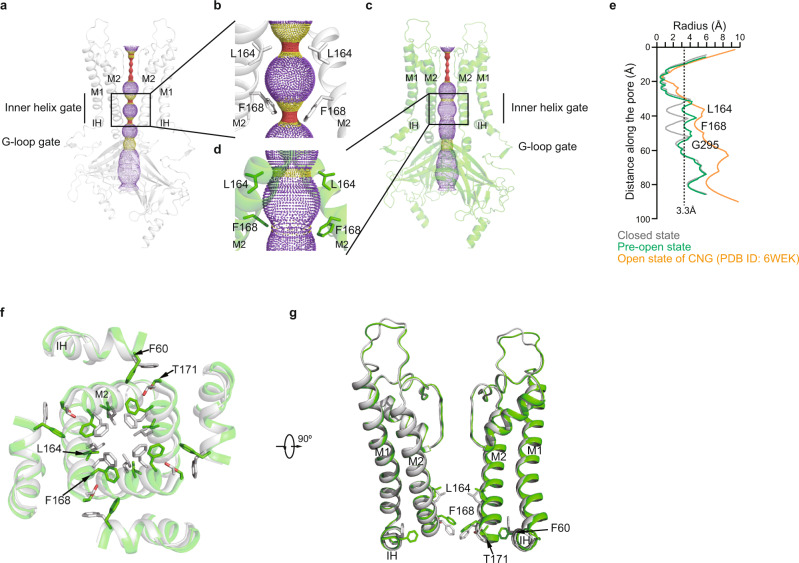
Fig. 2. The conformational changes of Kir6.2 TMD during KATP channel opening.
a Side view of Kir6.2 subunits of H175Kcryo-EM in the closed state. The ion conduction pathway along the pore is shown as dots and colored as red, yellow, and purple according to the pore radii of <1.4, 1.4–3.3, and >3.3 Å. M1, M2, and IH are labeled. For clarity, the subunits in front and in the back were omitted. b Close-up view of M2 helices in (a) with gate residues shown as sticks (L164 and F168). c Side view of Kir6.2 subunits of H175Kcryo-EM in the pre-open state. d Close-up view of M2 helices in (c). e Calculated pore profiles of the H175Kcryo-EM closed state (gray), H175Kcryo-EM pre-open state (green), and the open state of CNG channel (PDB ID: 6WEK) (orange). The size of a fully hydrated potassium ion (3.3 Å) is shown as dashes. f Structural comparison of the transmembrane domain between the closed state (gray) and the pre-open state (green). g A 90° rotated view of (d).

