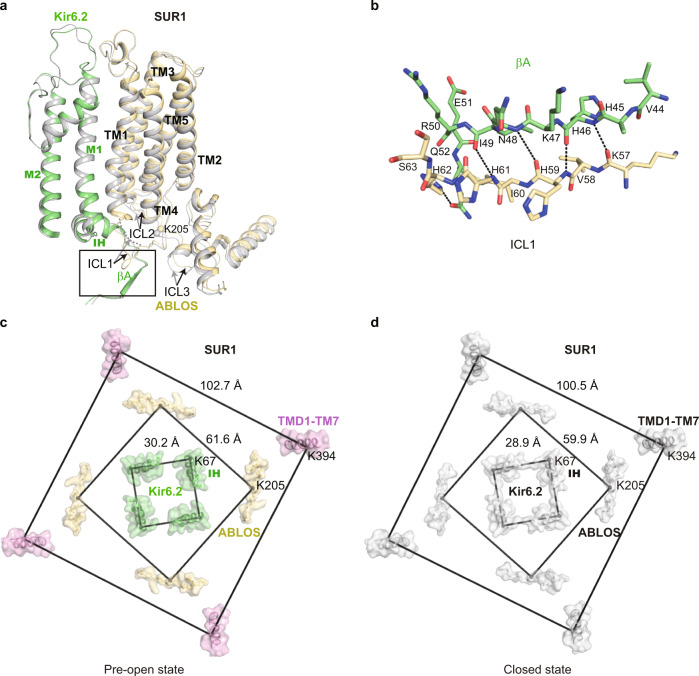
Fig. 4. Conformational changes of SUR1 during KATP channel opening.
a Structural comparison of SUR1 TMD0 between the closed state (gray) and the pre-open state (colored) of H175Kcryo-EM. b Close-up view of the interaction between βA of Kir6.2 and SUR1-ICL1 boxed in (a). Putative hydrogen bondings are shown as dashes. c, d Bottom view of the structural arrangement of the KATP complex during channel opening. Cα positions of K67 on IH of Kir6.2, K205 on ABLOS of SUR1, and K397 on M7 of SUR1 are shown as spheres. Distances of marker atoms in the pre-open state (colored) and the closed state (gray) are shown in (c, d), respectively.

