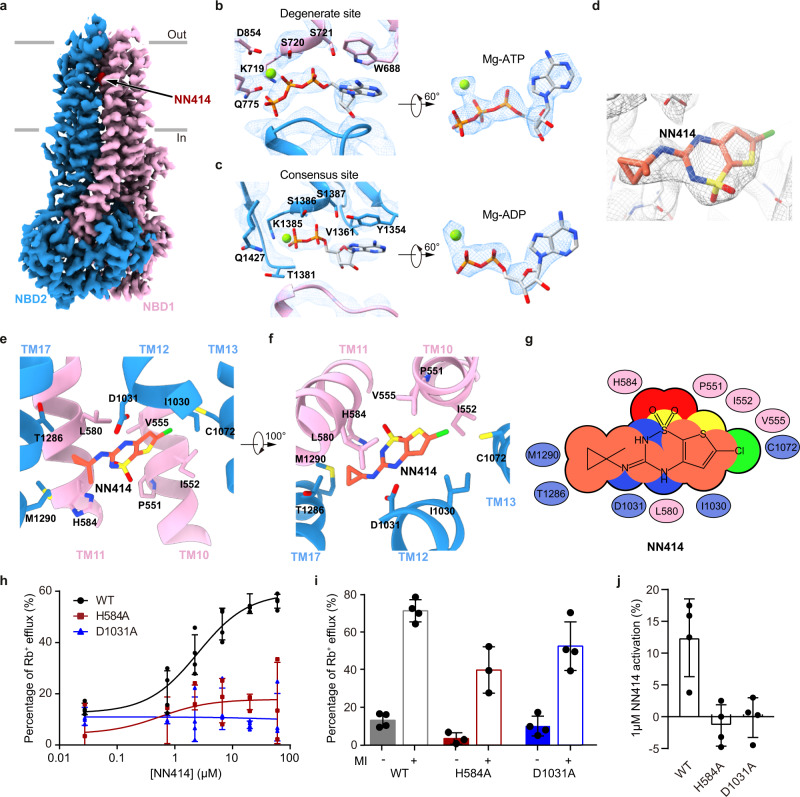
Fig. 5. Structure of the SUR1 subunit in complex with NN414 and Mg-nucleotides.
a Cryo-EM density map of SUR1 in complex with Mg-nucleotides and NN414, viewed from the side. The approximate position of the lipid bilayer is indicated by gray bars. TMD1-NBD1, TMD2-NBD2, and NN414 are colored in pink, blue and red, respectively. For better visualization of the position of NN414, a fragment of TMD2 in front of NN414 was omitted. b Close-up views of electron densities at the degenerate site. NBD1, NBD2, nucleotides, and Mg2+ are colored in pink, blue, gray, and green, respectively. c Electron densities at the consensus sites. d NN414 density (orange) in the SUR1 subunit (gray). The map is shown as mesh and the protein is shown as sticks. e, f Close-up views of the NN414-binding site. TMD1 and TMD2 are colored in pink and blue, respectively. NN414 (orange) and residues that interact with NN414 are shown as sticks. g Cartoon representation of the interaction between NN414 and SUR1. The key residues on TMD1 and TMD2 are shown as pink and blue ovals, respectively. h The dose-response activation curves of SUR1- Kir6.2 KATP channel by NN414 measured by Rb+ efflux assay. Curves were fitted to the Hill equation. Data are shown as mean ± SD and WT and D1031A n = 4, H584A n = 3 independent Rb+ efflux assays, respectively. i Effects of metabolism inhibitors (MI) on KATP channel containing various SUR1 mutants. Data are shown as mean ± SD and WT and D1031A n = 4, H584A n = 3 independent Rb+ efflux assays corresponding to (h). j KATP channel activation by 1 µM NN414 in the presence of 0.1 mM Mg-ATP. Data are shown as mean ± SD and n = 3 independent patches. Source data are provided as a Source Data file.

