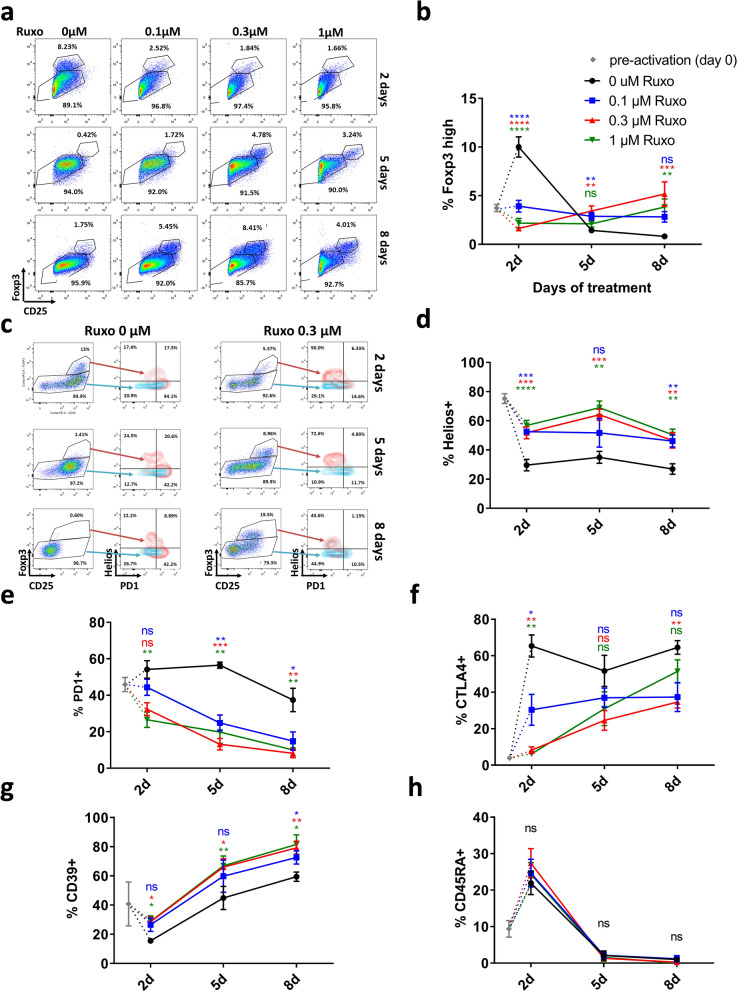
Figure 1.
In vitro activated huPBMNCs in the presence of ruxolitinib show increased percentages of CD4+ Foxp3 high Helios+ cells along time. (a) Representative cytometry dot plots of huPBMNCs activated with anti-CD3 and anti-CD28 at different times and ruxolitinib doses. Dot plots show CD25 and Foxp3 staining of CD4+ gated cells. (b) Quantification of Foxp3high cells of gated CD4+ huPBMNCs. Mean and standard error of the mean (S.E.M.) of a minimum of 4 independent experiments is represented for each condition. (c) Representative cytometry dot plots of huPBMNCs activated with anti-CD3 and anti-CD28 at different times and with 0 or 0.3 µM ruxolitinib. Dot plots show CD25 and Foxp3 staining of CD4+ gated cells, and density plots show Helios and PD1 staining. (d) Quantification of Helios+ cells of gated CD4+ Foxp3high huPBMNCs. n = 6. (e) Quantification of PD1+ cells of gated CD4+ Foxp3high huPBMNCs. n = 6. (f) Quantification of CTLA4+ cells of gated CD4 + Foxp3high huPBMNCs. n = 4. (g) Quantification of CD39+ cells of gated CD4+ Foxp3high huPBMNCs. n = 4. (h) Quantification of CD45RA+ cells of gated CD4+ Foxp3high huPBMNCs. n = 4. One way ANOVA test with Dunnett’s correction for multiple comparisons p values are shown. Each treatment is compared with the 0 ruxolitinib control. p values: *< 0.05, **< 0.01, ***< 0.001, ****< 0.0001.

