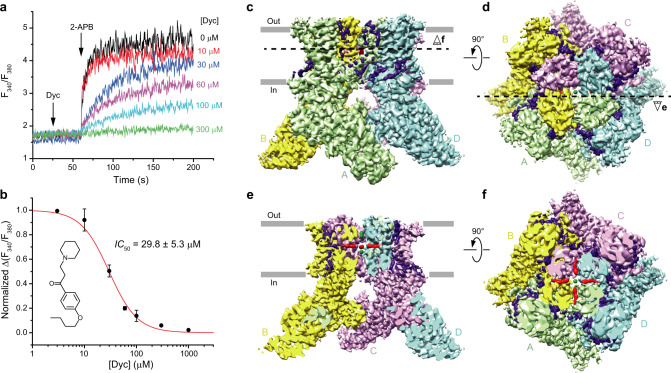
Fig. 1. Dyclonine inhibition and cryo-EM.
a Representative ratiometric Fura-2-based fluorescence measurements of changes in intracellular Ca2+ for HEK 293 GnTI− cells expressing wild-type mouse TRPV3. The changes in the fluorescence intensity ratio at 340 and 380 nm (F340/F380) were monitored in response to the addition of 200 µM 2-APB (arrow) after pre-incubation of cells with various concentrations of dyclonine. The experiment was repeated independently seven times with similar results. b Dose–response curve for TRPV3 inhibition by dyclonine. The changes in the F340/F380 ratio were normalized to its maximal value in the absence of dyclonine and fitted by the logistic equation (red line), with IC50 = 29.8 ± 5.3 µM and nHill = 1.61 ± 0.27 (n = 7 independent experiments). The values are mean ± SEM. The inset shows the chemical structure of dyclonine. Source data are provided as a Source Data file. c, d 3D cryo-EM reconstruction of TRPV3Dyc viewed from the side (c) or top (d), with subunits colored green, yellow, purple, and cyan. e, f The same cryo-EM density as in (c, d), but cut off along the dashed lines in (d) and (c), respectively. Putative densities for dyclonine and sodium ions are shown in red and green.

