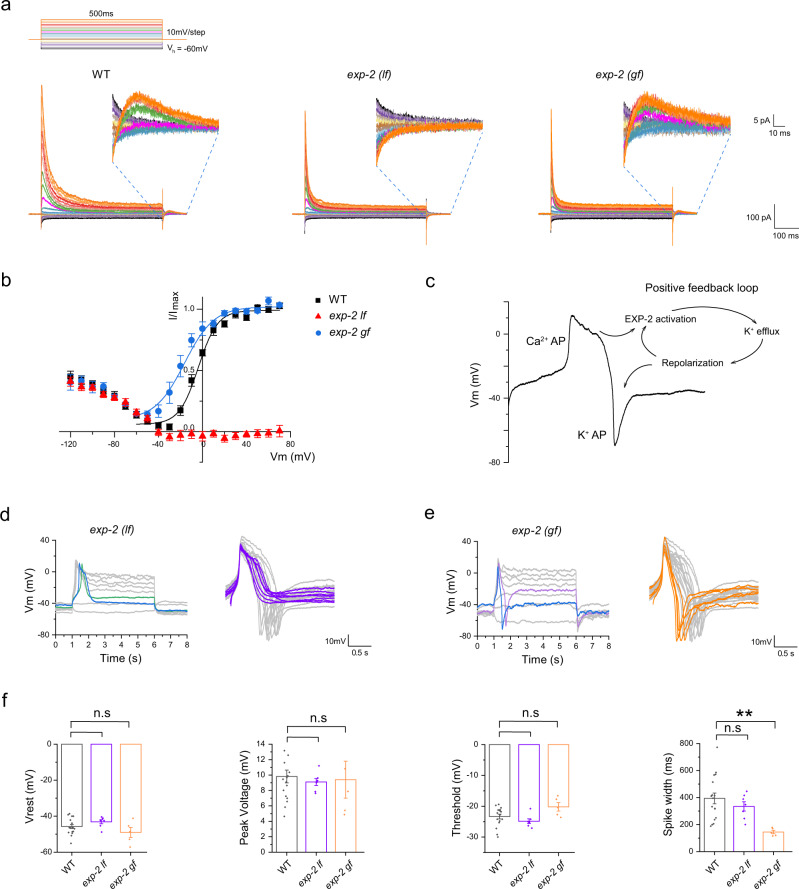
Fig. 3. AVL negative spike is mediated by a repolarization-activated K channel EXP-2.
a Representative whole-cell currents recorded from AVL in wild-type (left panel), exp-2(lf) (middle panel), and exp-2(gf) mutant animals (right panel). Top: voltage-clamp steps used: holding potential is −60 mV, each step is 500 ms long in 10 mV increment. Inserts: zoomed-in view of currents from 0 to ~70 ms after returning to holding potential from serial voltage-clamp steps. b Current-voltage (I–V) relationships of normalized repolarization-activated currents for WT (black square), exp-2(lf) (red triangle), and exp-2(gf) (blue circle). WT and exp-2(gf) IV curves were fitted with the Boltzmann function (color-matching curves). c Schematic of action potential generation in AVL. The negative potassium spike is intrinsically coupled to the preceding positive calcium spike via a positive-feedback loop mediated by repolarization-activated potassium channel EXP-2. d, e Representative action potential traces recorded from exp-2(lf) and exp-2(gf) AVL. Right panels: overlay of isolated single-action potential spikes from exp-2(lf) (purple traces, note the absence of negative spikes) and exp-2(gf) (orange traces, note the narrow spike width) aligned to the wild-type traces (gray). f Statistical comparison of action potential measurements between different genotypes. The averaged spike width in exp-2(gf) is significantly narrower than that of the WT. Asterisks indicate significant differences: **p = 0.00348. WT measurements are the same as in Figs. 1c and 2g. Resting membrane potential (Vrest): exp-2(lf): −43.1 ± 1.1 mV; exp-2(gf): −49.0 ± 2.8 mV. Peak amplitude: exp-2(lf): 9.1 ± 0.4 mV; exp-2(gf): 9.4 ± 2.4 mV. Threshold: exp-2(lf): −24.8 ± 0.8 mV; exp-2(gf): −20.2 ± 1.4 mV. Spike width: exp-2(lf): 334.7 ± 34.5 ms; exp-2(gf): 144.9 ± 12.8 ms. The number of animals recorded per genotype: exp-2(lf): n = 7; exp-2(gf): n = 5. The error bar is SEM. Statistics used was a two-sided two-sample t-test. Source data are provided as a Source Data file.

