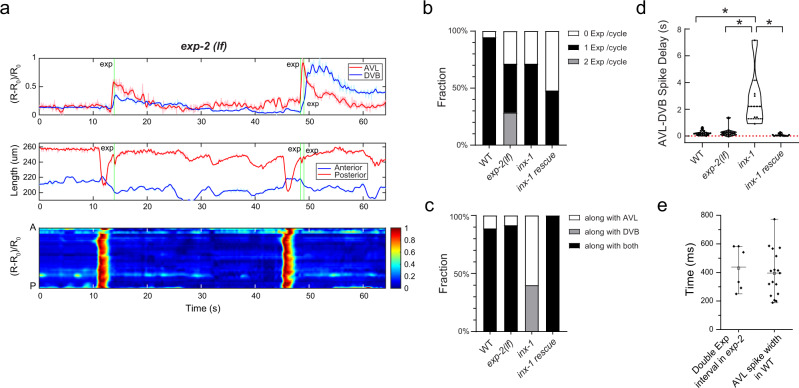
Fig. 7. The AVL negative spike inhibits excessive expulsion per defecation cycle.
a Top: Representative (normalized) calcium activities of AVL (red) and DVB soma (blue) in exp-2(lf) mutants. Middle: Corresponding changes of the length of the anterior (blue) and posterior (red) half of the worm body. Bottom: Corresponding normalized intestinal calcium activities along the worm body axis (A: anterior, P: posterior). Green vertical lines: Timing of expulsion. b Fraction of DMP cycles associated with different numbers of expulsion occurrence (WT: n = 19 from 12 animals; exp-2(lf): n = 21 from 6 animals; inx-1: n = 14 from 3 animals; inx-1(rescue): n = 25 from 5 animals). c Fraction of expulsions per cycle associated with AVL or DVB firing or both (WT: n = 18 from 12 animals; exp-2(lf): n = 12 from 6 animals; inx-1: n = 10 from 3 animals; inx-1(rescue): n = 12 from 5 animals). d Time delay between AVL and DVB spikes in wild-type, exp-2(lf), inx-1, and inx-1 rescued animals (WT: n = 19 from 12 animals; exp-2(lf): n = 12 from 6 animals; inx-1: n = 6 from 3 animals; inx-1(rescue): n = 12 from 5 animals). Data were presented in a violin plot. Asterisks indicate significant differences: *P < 0.05 in unpaired Student’s t-test with Welch’s correction. The statistical test was two-sided. WT vs inx-1: P = 0.0382; inx-1 vs inx-1(rescue): P = 0.0318; exp(lf) vs inx-1: P = 0.0413. e Time delay between two consecutive expulsions within the same cycle in exp-2(lf) mutants (n = 6) and the spike width of AVL action potentials in wild-type animals (n = 17). Data were presented as mean values ± SEM. The center is the mean value and the error bar is SEM. Source data are provided as a Source Data file.

