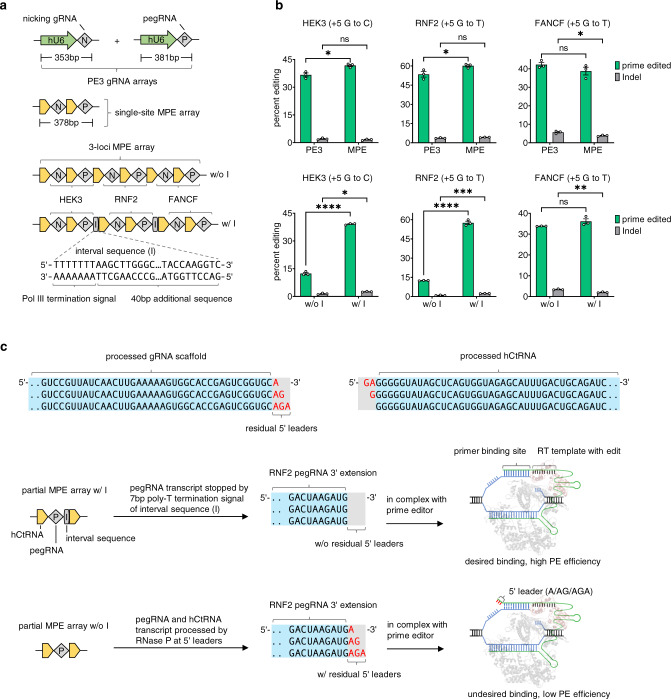
Fig. 4. MPE with DAP arrays.
a Schematic of MPE development. The size of PE3 gRNA arrays and single-site MPE array were compared using gRNA sequences designed for RNF2 (+5G to T). b Efficient single-site and 3-loci MPE. The w/o I and w/ I arrays were compared for 3-loci MPE. c Schematic illustration of the observed low 3-loci MPE efficiency (w/o I) in b. After the endogenous processing of the MPE array without interval sequence (w/o I), partial or complete 5′ leader sequences will remain at the 3′ end of pegRNA, which causes undesired primer binding and decreases the PE efficiencies. By adding the interval sequence (w/ I) at the 3′ end of pegRNA, the poly-T termination signal will isolate the original 3′ end of pegRNA from additional sequences, achieving desired binding and expected PE efficiencies. All tests were performed in HEK293T cells and analyzed using NGS. Detailed protospacers, edited bases, amplicons, primers, and plasmid maps of the relevant figures are available in Supplementary Tables 1 and 5. Error bars in b represent mean ± s.e.m. from n = 3 replicates (unpaired two-tailed t-test; ns not significant; *P < 0.05; **P < 0.01; ***P < 0.001; ****P < 0.0001). P = 0.0146 (prime edited value comparison between MPE and PE3 for HEK3 (+5G to C)). P = 0.0444 (prime edited value comparison between MPE and PE3 for RNF2 (+5G to T)). P = 0.0166 (Indel value comparison between MPE and PE3 for FANCF (+5G to T)). P = 1.87E-06 (prime edited value comparison between w/o I and w/ I for HEK3 (+5G to C)). P = 0.0113 (Indel value comparion between w/o I and w/ I for HEK3 (+5G to C)). P = 4.44E−06 (prime edited value comparison between w/o I and w/ I for RNF2 (+5G to T)). P = 0.0006 (Indel value comparison between w/o I and w/ I for RNF2 (+5G to T)). P = 0.002 (Indel value comparison between w/o I and w/ I for FANCF (+5G to T)).

