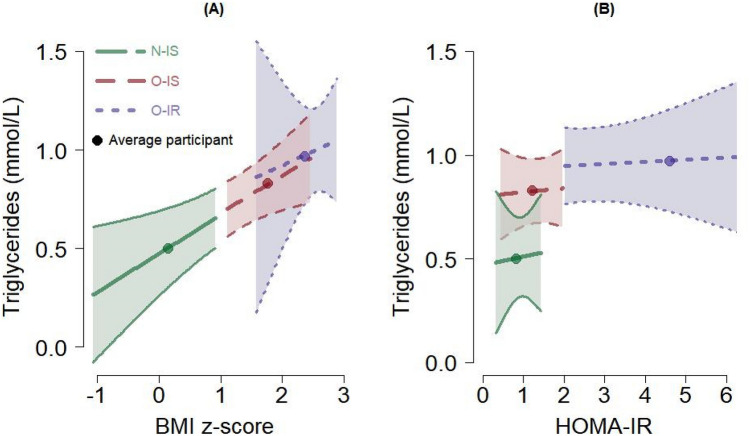
Figure 2.
Expected values and 95% confidence intervals of triglycerides (mmol/L) from the regression model, profiled by the BMI z-score (A) and the HOMA-IR (B). The expected value for the average participant in each group is also plotted; see Table 1. The segment for each group covers the range of values observed for the given group (except for the O-IR group on HOMA-IR where the maximum observed HOMA-IR was 9.6). Forty-one participants contributed data for these figures.

