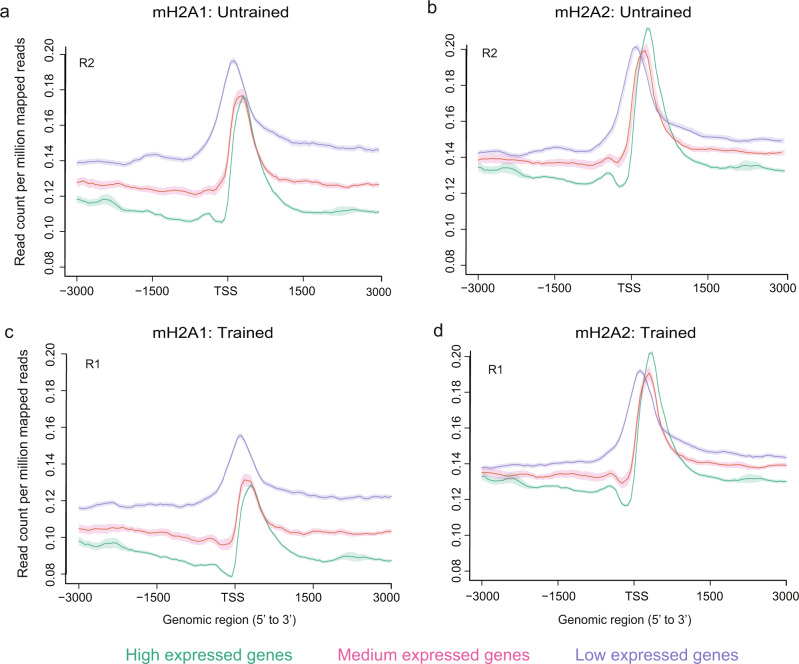
Fig. 4. mH2A1 and mH2A2 binding is negatively associated with gene expression.
Average profile plot of mH2A1 binding at the TSS for all genes grouped into three categories of gene expression (high, medium and low) shows that mH2A1 (a) and mH2A2 (b) enrichment is inversely proportional to gene expression in untrained (c) and trained (d) mice. Data for each mH2A protein are shown for individual replicates from untrained (replicate 2; R2) and trained (replicate 1; R1) groups.

