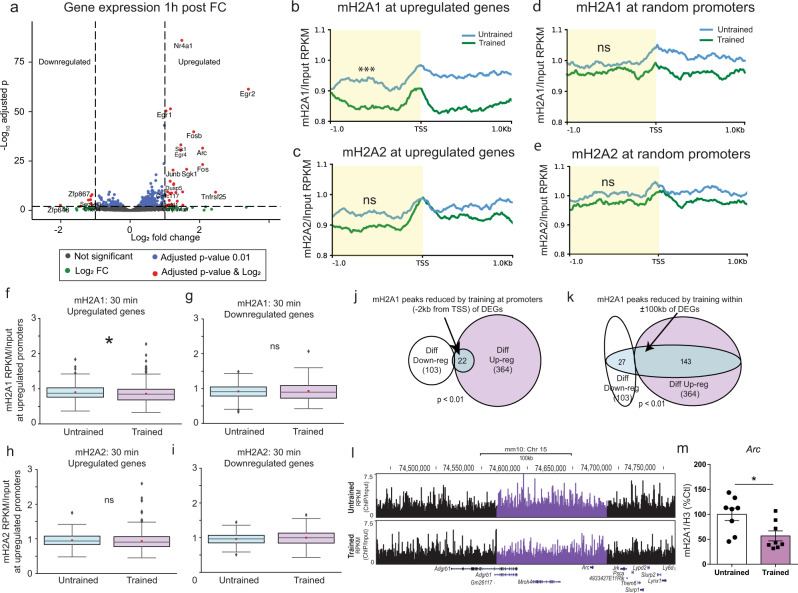
Fig. 6. Learning-induced mH2A1 removal after 30 min occurs on upregulated genes.
a Analysis of gene expression 1 h after contextual fear conditioning (n = 3 untrained, 2 trained). Blue and red circles indicate significantly altered genes. 364 of 467 differentially expressed genes (DEGs) were upregulated with fear conditioning. Average profile plot of b mH2A1 and c mH2A2 binding at TSS-flaking regions of upregulated genes. Upon training, mH2A1 signal is significantly reduced on promoters compared to untrained controls. There is no difference in mH2A2 binding on promoters of upregulated genes between trained and untrained mice. Average profile of d mH2A1 and e mH2A2 binding at promoters of randomly selected genes. There is no statistical difference in mH2A1 or mH2A2 binding on randomly selected promoters between trained and untrained mice. f, g Box plots comparing mH2A1 binding RPKM (mean across replicates) normalised to mean input RPKM values at promoters (−2 kb) in trained vs untrained mice on up- and down-regulated genes. Similarly, box plots were generated at h Upregulated DEGs and i Downregulated DEGs for comparison of mH2A2 binding between untrained and trained mice. Only mH2A1 shows a significant decrease in binding in trained compared to untrained samples for upregulated DEGs promoters, while mH2A2 show no significant changes in its binding in trained compared to untrained samples for either up or down regulated DEGs. j Venn diagrams demonstrating significant over-representation (p < 0.01, hyper-geometric test) of reduced mH2A1 signal on promoters (proximal regions) of differentially upregulated compared to promoters of upregulated DEGs. k Venn diagrams demonstrating significant over-representation (p < 0.01, hyper-geometric test) of reduced mH2A1 signal on extended regions (flanking ±100 kb from the centre of the peak) of upregulated compared to downregulated DEGs, implicating distal regulatory elements (e.g., enhancers/silencers). l University of California at Santa Cruz (UCSC) Genome Browser track (mm10 assembly) demonstrating significant decrease in mH2A1 binding 30 min after fear conditioning. Reads are normalised by dividing ChIP by Input. m To validate the learning-induced mH2A1 reduction observed with ChIP-seq, we fear conditioned a separate set of mice (n = 8/group) and measured mH2A1 binding (normalised to H3) 30 min later. As with ChIP-seq, there was a significant reduction in mH2A1 binding at the Arc promoter upon learning. Data are shown as mean ± SEM. (ns p > 0.05, *p < 0.05).

