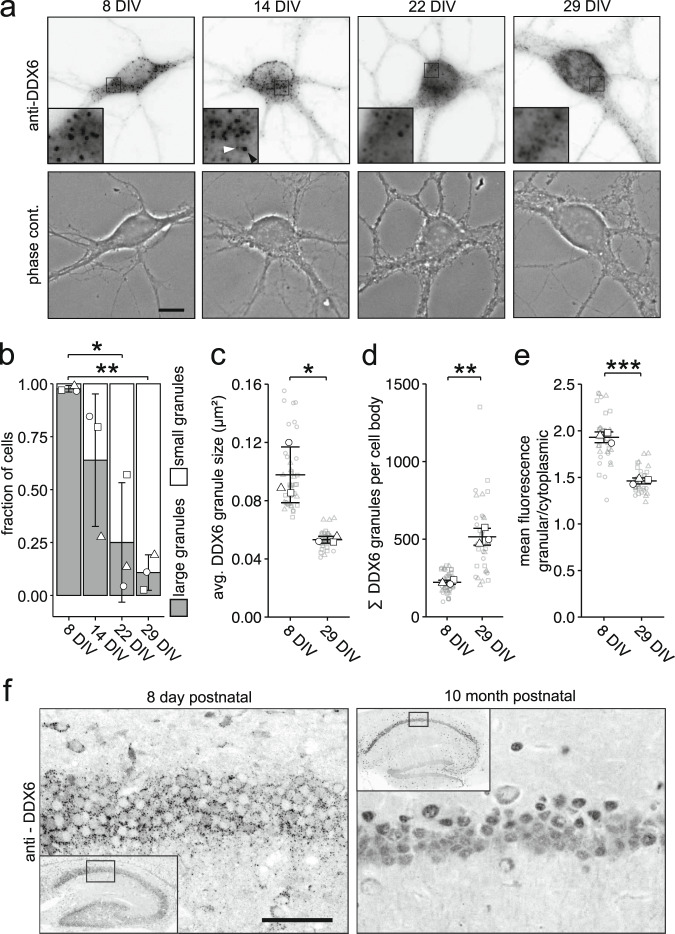
Fig. 1. Cytoplasmic DDX6 granules disassemble during neuronal maturation in cell culture and in vivo.
a Representative examples of DDX6 immunostaining and phase contrast of 8, 14, 22, and 29 days in vitro (DIV) hippocampal neurons in culture. Boxed regions in images are displayed as magnified insets. White arrowhead indicates representative small granule, black arrowhead indicates representative large granule. Scale bar 10 µm. b Bar plot displaying quantification of cell population by fraction of cells containing either large or small DDX6 granules as exemplified in a, at 8, 14, 22 and 29 DIV, respectively. Data represents mean ± standard deviation of three independent neuronal cultures. Distinct dot symbols indicate biological replicates. At least 100 cells/condition/experiment were quantified. Asterisks represent p-values obtained by Tukey’s test post-hoc to one-way ANOVA analysis (*p < 0.05, **p < 0.01). F3,8 = 0.0044. c, d, e Dot plots displaying average DDX6 granule size (c), total DDX6 granule number (d) and granular to cytoplasmic DDX6 fluorescence ratio (e) of individual cell bodies in 8 and 29 DIV hippocampal neurons in culture. Small gray symbols represent single cells while larger white symbols indicate the average of each replicate. Horizontal line and error bars represent mean of replicates and standard deviation (n = 3 biologically independent experiments). Asterisks represent p-values obtained by two-sided Student’s t-test (*p < 0.05, **p < 0.01, ***p < 0.001). p = 0.0452 (c); p = 0.0081 (d). f DDX6 immunostaining on sagittal brain tissue slices displaying the hippocampus of 8 day and 10 month postnatal mice. Boxed regions in overviews show location of magnified region. Scale bar 50 μm. This experiment was repeated independently 3 times with similar results.

