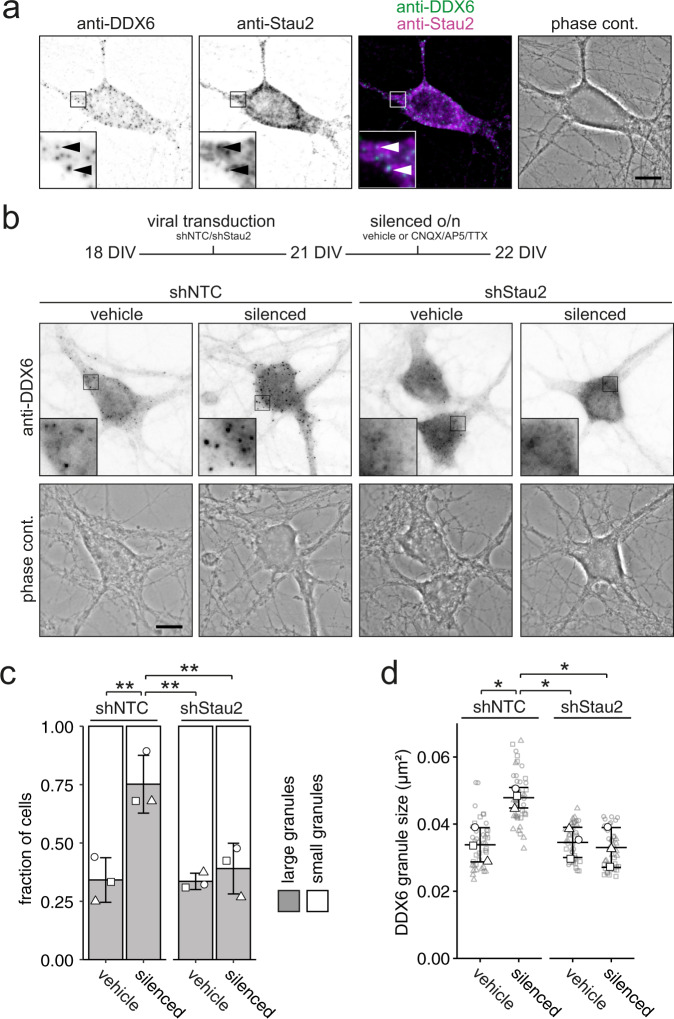
Fig. 3. Stau2 depletion inhibits DDX6 granule assembly upon neuronal inhibition.
a Representative example of DDX6 and Stau2 immunostaining, merge and phase contrast pictures of a 22 DIV hippocampal neuron. Arrowheads indicate instances of co-localization. b Experimental outline and representative examples of DDX6 immunostainings and phase contrast pictures of shNTC and shStau2 transduced 22 DIV hippocampal neurons in culture either under vehicle (DMSO) treated or silenced (100 µM CNQX, 50 µM AP5, 1 µM TTX) conditions. Boxed regions in images are displayed as magnified insets. Scale bars 10 µm. c Bar plot displaying quantification of cell population by fraction of cells containing either large or small DDX6 granules as exemplified in b. Distinct dot symbols indicate biological replicates. At least 100 cells/condition/experiment were quantified. d Dot plot displaying average DDX6 granule size of individual cell bodies. Small gray symbols represent single cells while larger white symbols indicate the average of each replicate. Data represents mean ± standard deviation of three independent neuronal cultures. Asterisks represent p-values obtained by Tukey’s test post-hoc to two-way ANOVA analysis (*p < 0.05, **p < 0.01). F1,8 = 0.00316, Stau2 depletion (c); F1,8 = 0.0110, neuronal inhibition (c), F1,8 = 0.0336, Stau2 depletion (d); F1,8 = 0.0530, neuronal inhibition (d).

