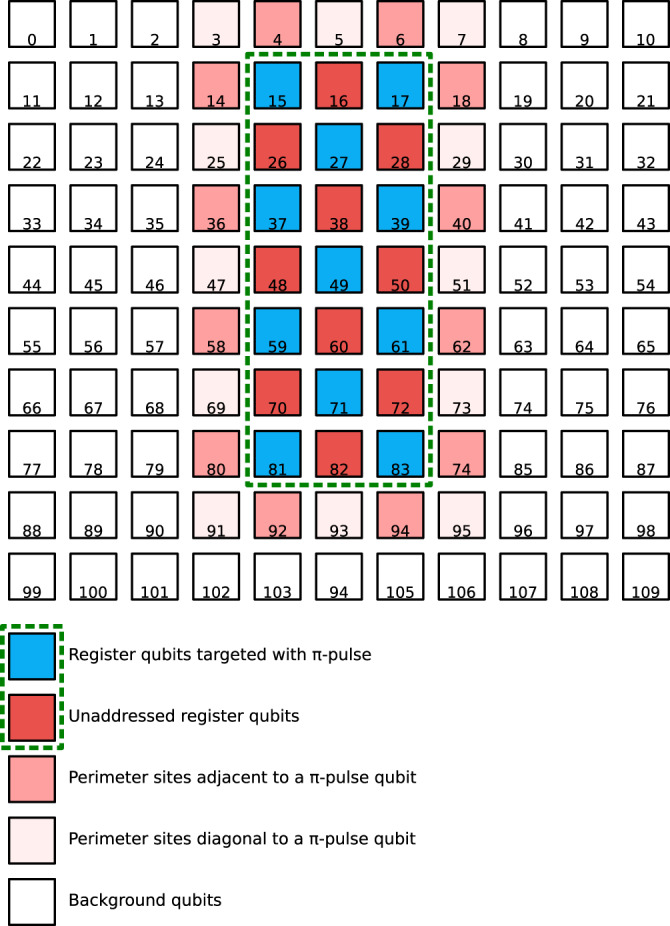
Fig. 6. Diagram depicting schematically each site in the full 10 × 11 array and indicating the location of the computational array (green dashed box).

The color of each box represents indicates qubits that are driven (blue) or undriven (red) within the computational array for the data presented in Fig. 3a. Additionally, the shading of the sites around the perimeter of the computational array indicates whether that site neighbored a driven qubit or an undriven qubit. All qubits more than one site away from the computational array are categorized as background atoms and are assumed to be undriven by the gate beams.
