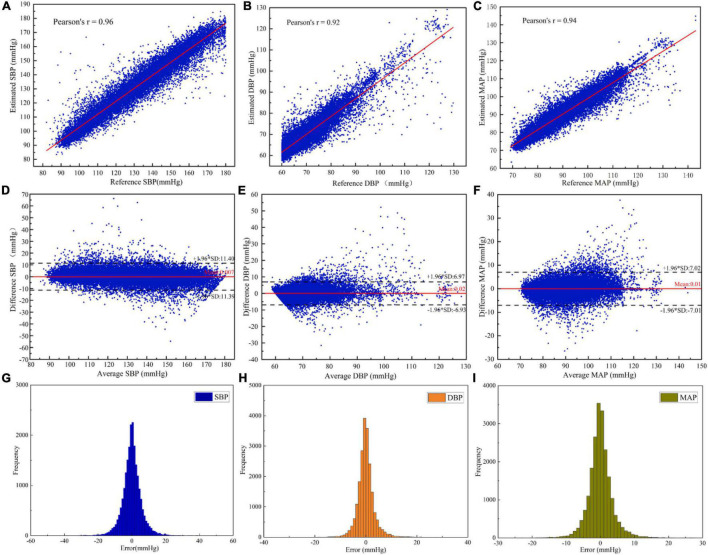
FIGURE 4.
Evaluation of the estimated BP performance of the MST-net model: (A) SBP correlation coefficient plot; (B) DBP correlation coefficient plot; (C) MAP correlation coefficient plot; (D) Bland-Altman plot of SBP; (E) Bland-Altman plot of DBP; (F) Bland-Altman plot of MAP; (G) Error histogram for SBP; (H) Error histogram for DBP; and (I) Error histogram for MAP.

