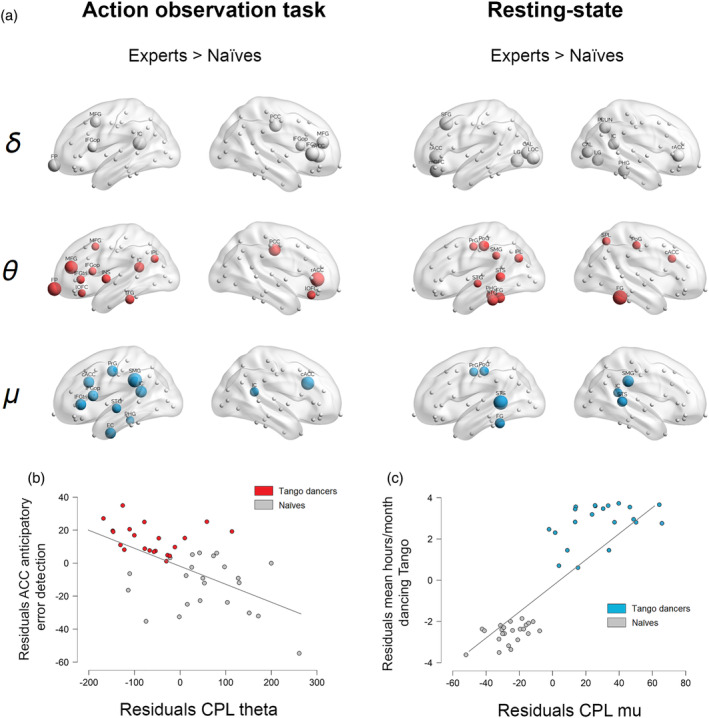
FIGURE 3.

Task‐related and resting‐state network differences between Tango dancers and naïves and multiple regression results. (a) Spatial distribution of the brain network nodes showing maximal strength difference between groups (Tango dancers > naïves) in delta (δ = 1.5–4 Hz in gray), theta (θ = 4–8 Hz in red), and mu (μ = 8–13 Hz in blue) rhythms. For visualization purposes, critical nodes have been defined as those scoring 1 SD above the mean of the strength difference in each condition and frequency band. Node size is proportional to the strength difference between groups. (b) Individual coefficient plot for the main effect of theta CPL on action error discrimination performance, controlling for all other predictors. (c) Individual coefficient plot for the main effect of mu CPL on the amount of time spent in dancing Tango per month, controlling for all other predictors. Please note, that the top‐ranked graph feature in the ML approach (i.e., CPL) only provides one single score per participant (i.e., and not a score per brain region, which is a necessary requisite to plot neural networks). Thus, we used strength to visualize the networks, as this metric provides a more general estimate of the degree of functional connectivity of the whole network
