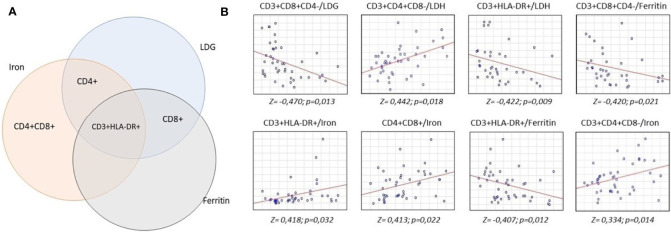
Figure 2.
Analysis of correlations of serum concentrations of lactate dehydrogenase, iron and ferritin with lymphocyte subpopulations. 16 ml of whole venous blood out of 43 patients was analyzed to measure lactate dehydrogenase, iron and ferritin levels and lymphocyte subpopulation count. Biochemical analysis was carried out by the colorimetric method, lymphocyte subpopulations studied by flow cytometry. Statistical analysis to find the relationship between these parameters was carried out according to Spearman test. (A) intersection of correlations between biochemical parameters and lymphocyte subpopulations. (B) revealed positive (upward axis) and negative (downward axis) correlations between lymphocyte subpopulations and biochemical parameters.

