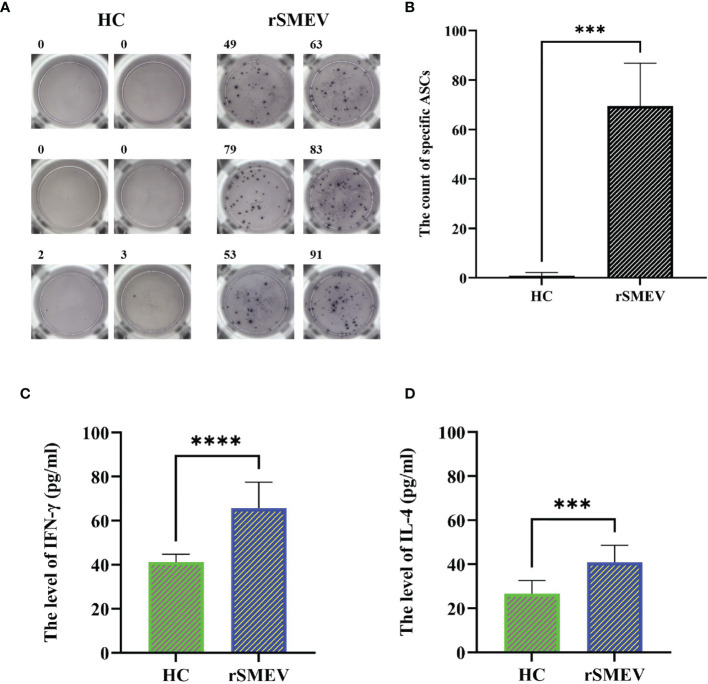
Figure 14.
The results of ELISPOT and ELISA experiments. (A) The representative ELISPOT spot diagram in HC and rSMEV groups. (B) The count of ASCs in the HC and rSMEV groups were significantly different (***P<0.001) after using the two independent sample t-test, and the statistical test was two-tailed. The t-value was 9.671 and the degree of freedom was 5.059 (***P < 0.001). (C) The two independent sample t-test of the level of IFN-γ between HC group and rSMEV group, and the difference was statistically significant (****P<0.0001), the t-value was 6.247 and the degree of freedom was 18. (D) The two independent sample t-test of the level of IL-4 between HC group and rSMEV group, and the difference was statistically significant (***P<0.001), the t-value was 4.652 and the degree of freedom was 18.

