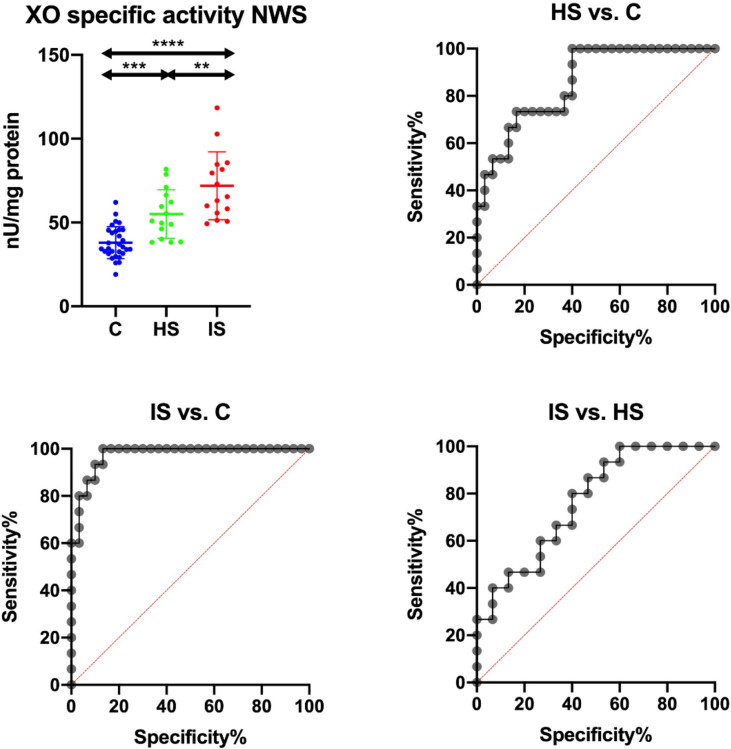
Figure 3.
Results of ROC analysis for salivary XO specific activity in NWS. C, Control group (n = 30); HS, hemorrhagic stroke group (n = 15); IS, ischemic stroke group (n = 15); NWS, non-stimulated whole saliva; XO, xanthine oxidase. Differences statistically significant at: **p < 0.005; ***p < 0.0005; ****p < 0.0001.

