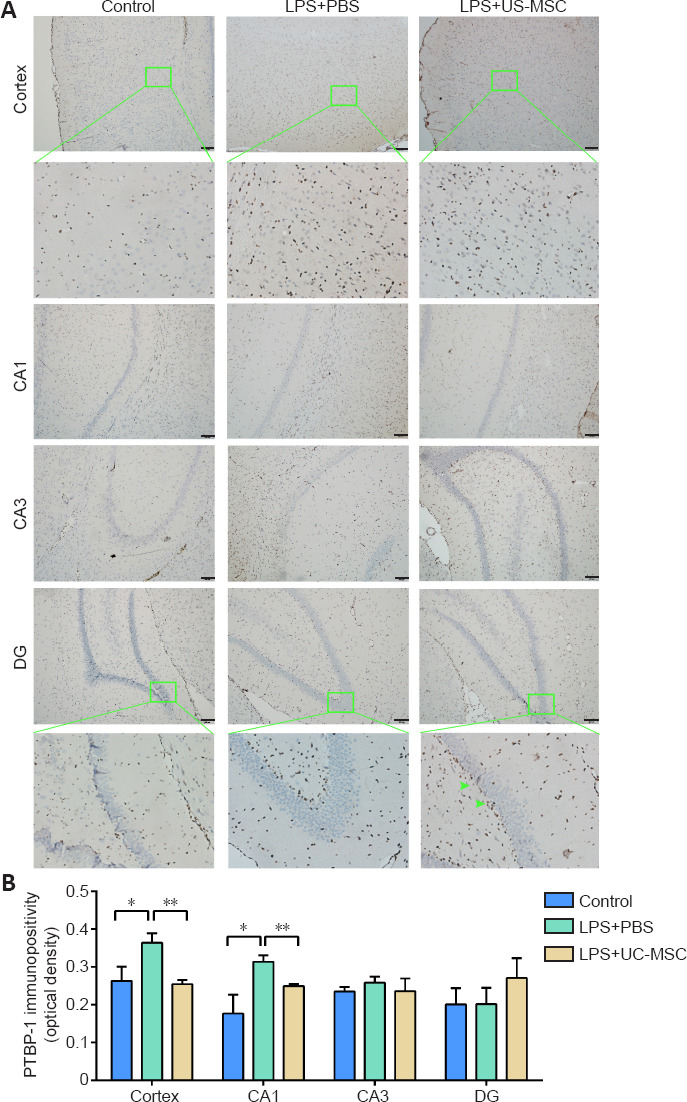
Figure 7.

Effect of UC-MSCs on the immunopositivity and distribution of PTBP-1 in various areas of the brain of neonatal rats with maternal immune activation-associated neonatal brain injury.
(A) The distribution of PTBP-1 (green arrows) in the cerebral cortex and hippocampal CA1, CA3, and DG (scale bars: 100 μm; 50 μm in enlarged parts). Cortex: under low magnification, the expression level of PTBP-1 protein in the LPS + PBS group was higher than that in the control group. After UC-MSCs administration, the expression level of PTBP-1 protein, compared with the LPS + PBS group, was lower. Under high magnification (green framed field), PTBP-1 was abundantly expressed in neurons and cell bodies around neurons, and PTBP-1-positive cells were distributed centripetally along the cortex. Hippocampus: under low magnification, the expression of PTBP-1 in the hippocampal CA1 area of the LPS + PBS group was higher than that in the control group and LPS + UC-MSC group. There was no significant difference between the control group, LPS + PBS group, and LPS + UC-MSC group in hippocampal CA3 and DG areas. Under high magnification, the PTBP-1-negative cells in the DG zone were loosely arranged and swollen in the LPS + PBS group; compared with the LPS + PBS group, the PTBP-1-positive cells and PTBP-1-negative cells in the UC-MSC group, were arranged more neatly and mainly distributed around the damaged neurons (green arrow). (B) Quantitative results of PTBP-1 immunopositivity. Data are expressed as mean ± SEM (n = 3). *P < 0.05, **P < 0.01 (one-way analysis of variance followed by the Student-Newman-Keuls method). DAPI: 4′, 6-Diamidino-2-phenylindole; DG: dentate gyrus; LPS: Lipopolysaccharides; PBS: phosphate-buffered saline; PTBP-1: Polypyrimidine tract-binding protein-1; UC-MSCs: umbilical cord-derived mesenchymal stem cells.
